Usage Summary
Each account has a Subscription Limit that defines the number of records available for processing in Data Integration, Tasks in Automation, and Traffic in Connect. While using Data Integration, Automation and Connect products you may impact the Subscription Limits usage. Usage Summary shows how many resources you have already used and how many you still have left. It provides the statistics for a specific period, groups it by workspace or integration, and breaks it down by days or months.
Note that the usage data is available from the 6th of September 2022.
To view the usage statistics, do the following:
- In Skyvia, click on your user icon in the top right corner of the page.
- Select Account.
- Select Usage Summary in the left menu.
Get Statistics for Period
Usage Summary allows getting statistics for a specific period. By default, it displays the records used for the current billing period.
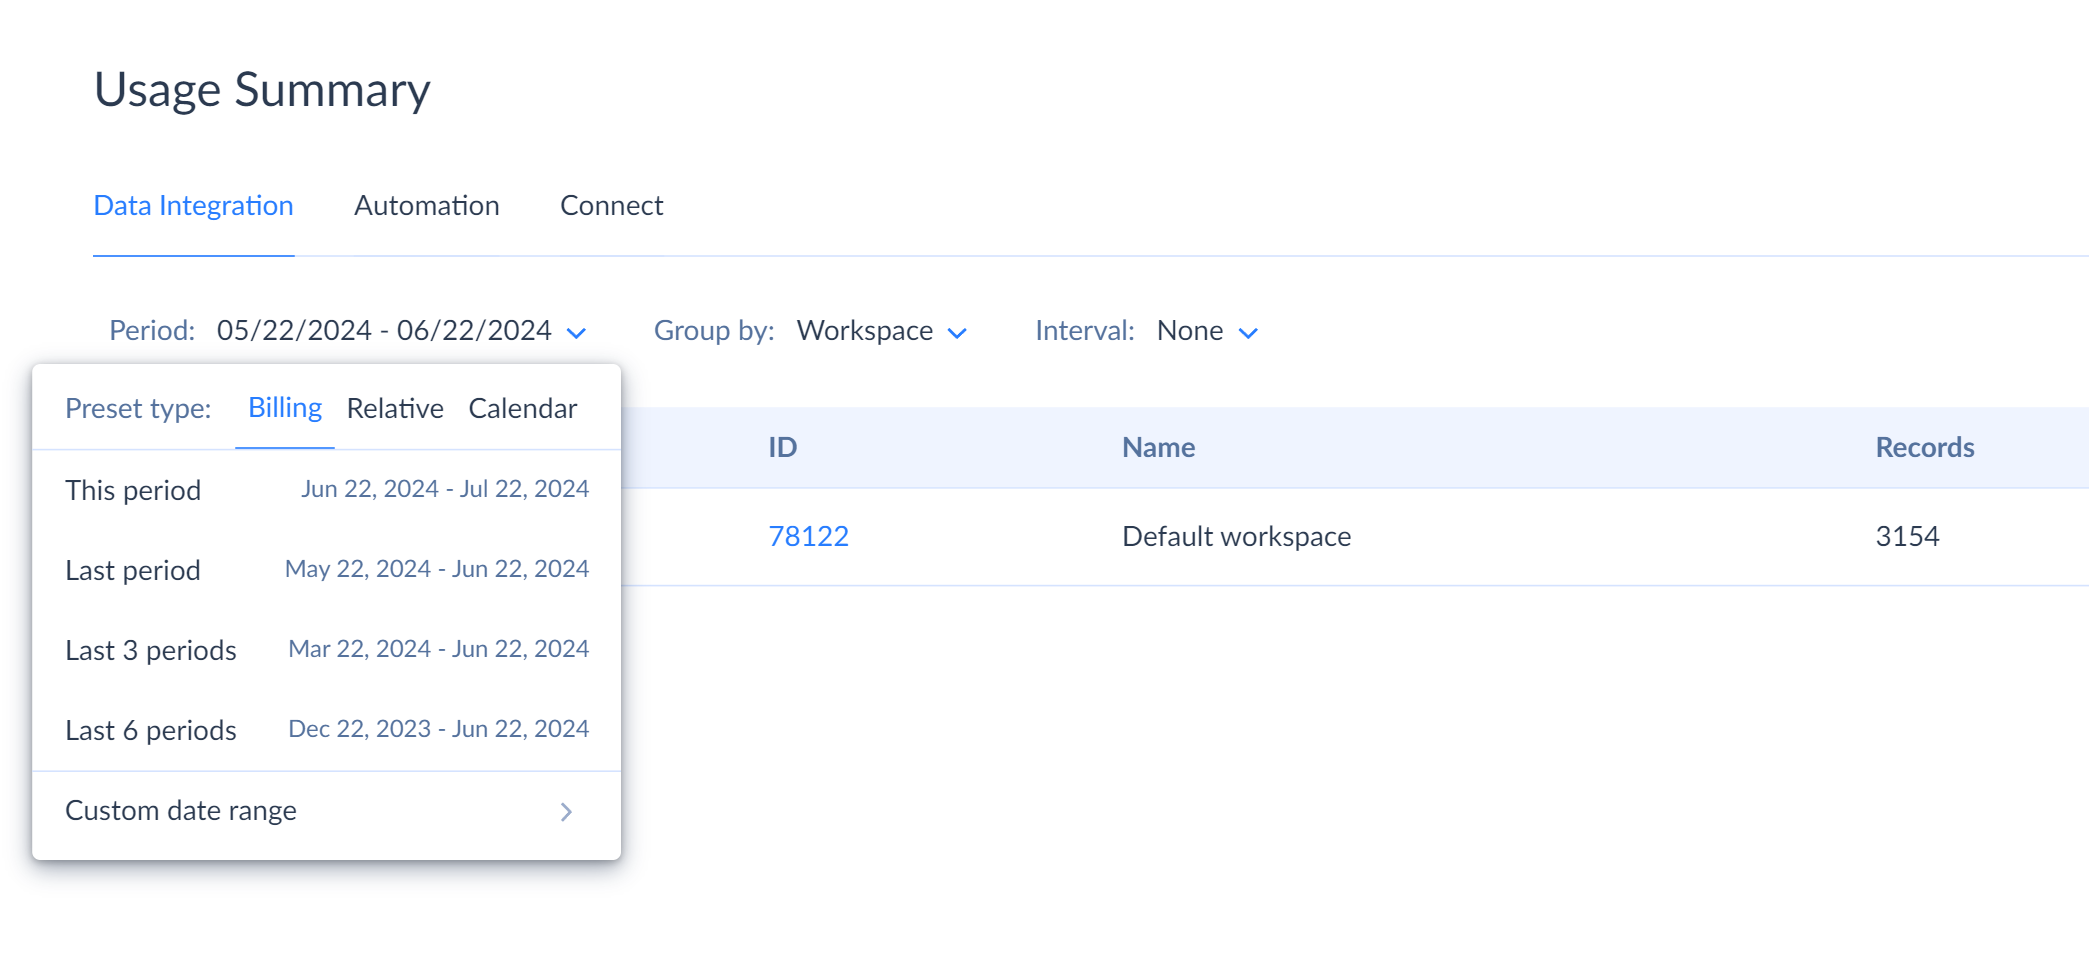
Click on the selected period to change the preset type and select the date range.
There are three preset types available: Billing, Relative, and Calendar.
Billing — gets statistics for your billing period. The billing period is individual and not related to calendar periods. For example, you purchased or upgraded the subscription on the 7th of December. In this case, your monthly billing period starts on the 7th day of every month.
Relative — gets the usage statistics starting from 7, 30, 90, or 365 days back from the current date.
Calendar — displays the usage statistics for a calendar week, month, or year. You can select the current or last year’s calendar periods.
Use Custom Date Range on the bottom to specify the custom dates for the usage report.
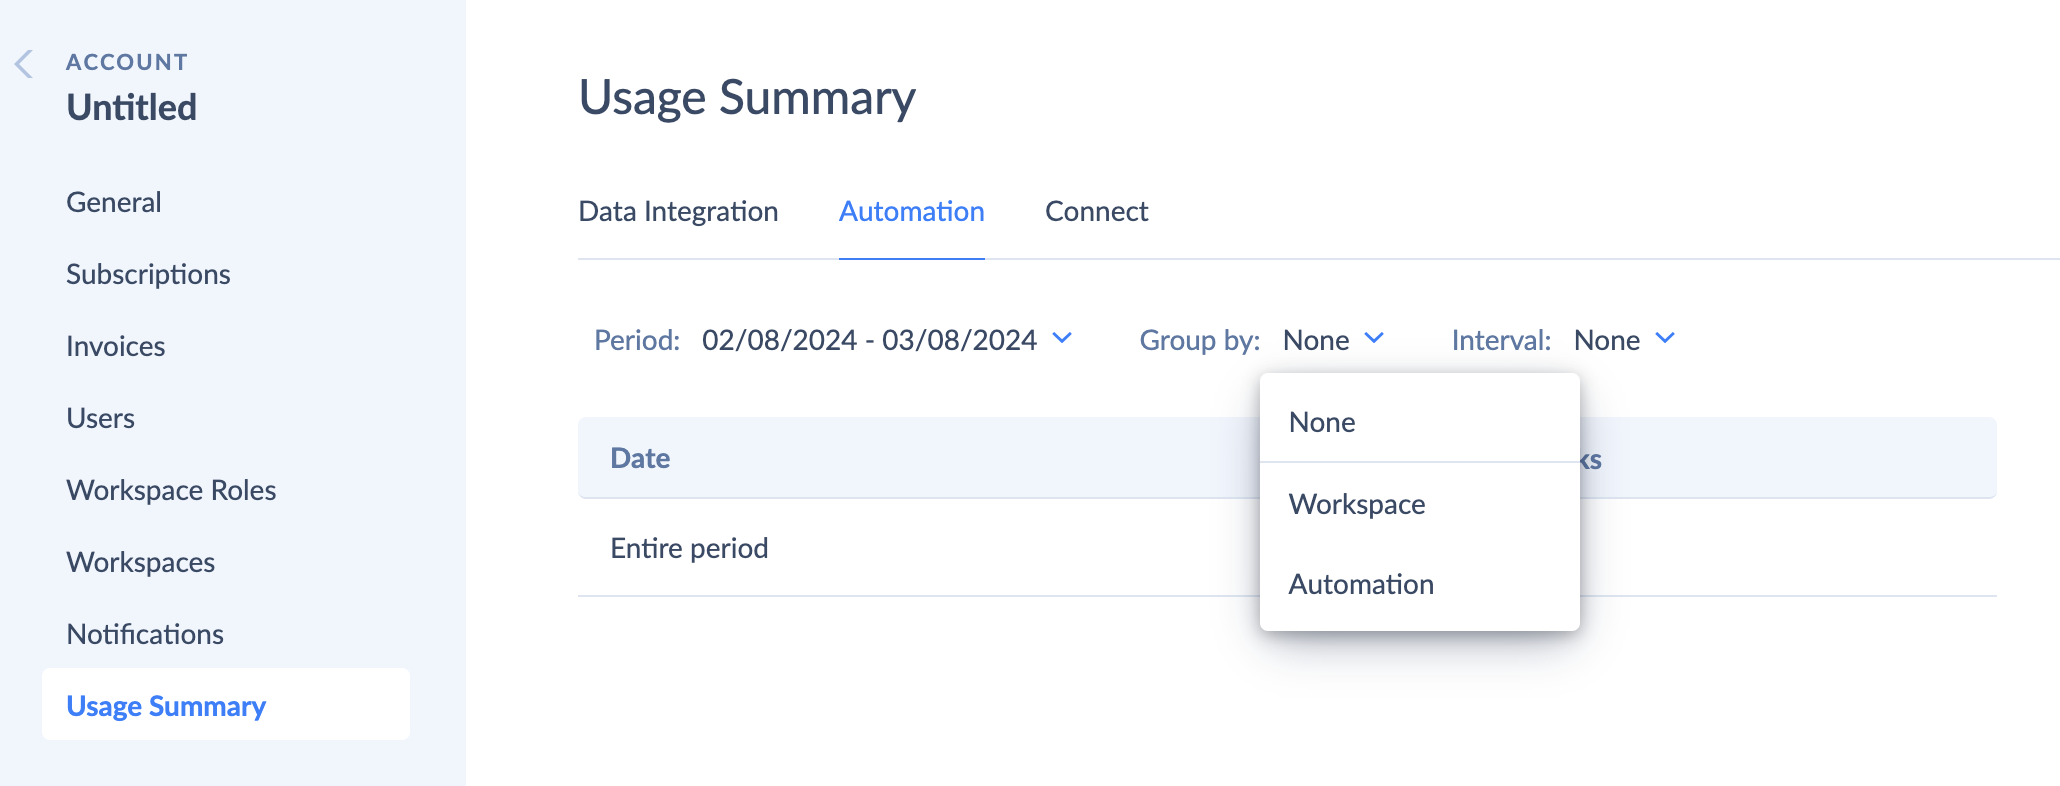
Details by Package or Workspace
Group by feature allows getting the total statistics by account, workspace, or package. Use Group by to see what workspaces and integrations consume your resources. By default, the Group by value is set to None displaying the total number of resources used by the account.
You can open the package directly from the usage summary page, just click on the package Id. The statistics is available even for the deleted objects. In this case, the report displays only the package Id without the package title.
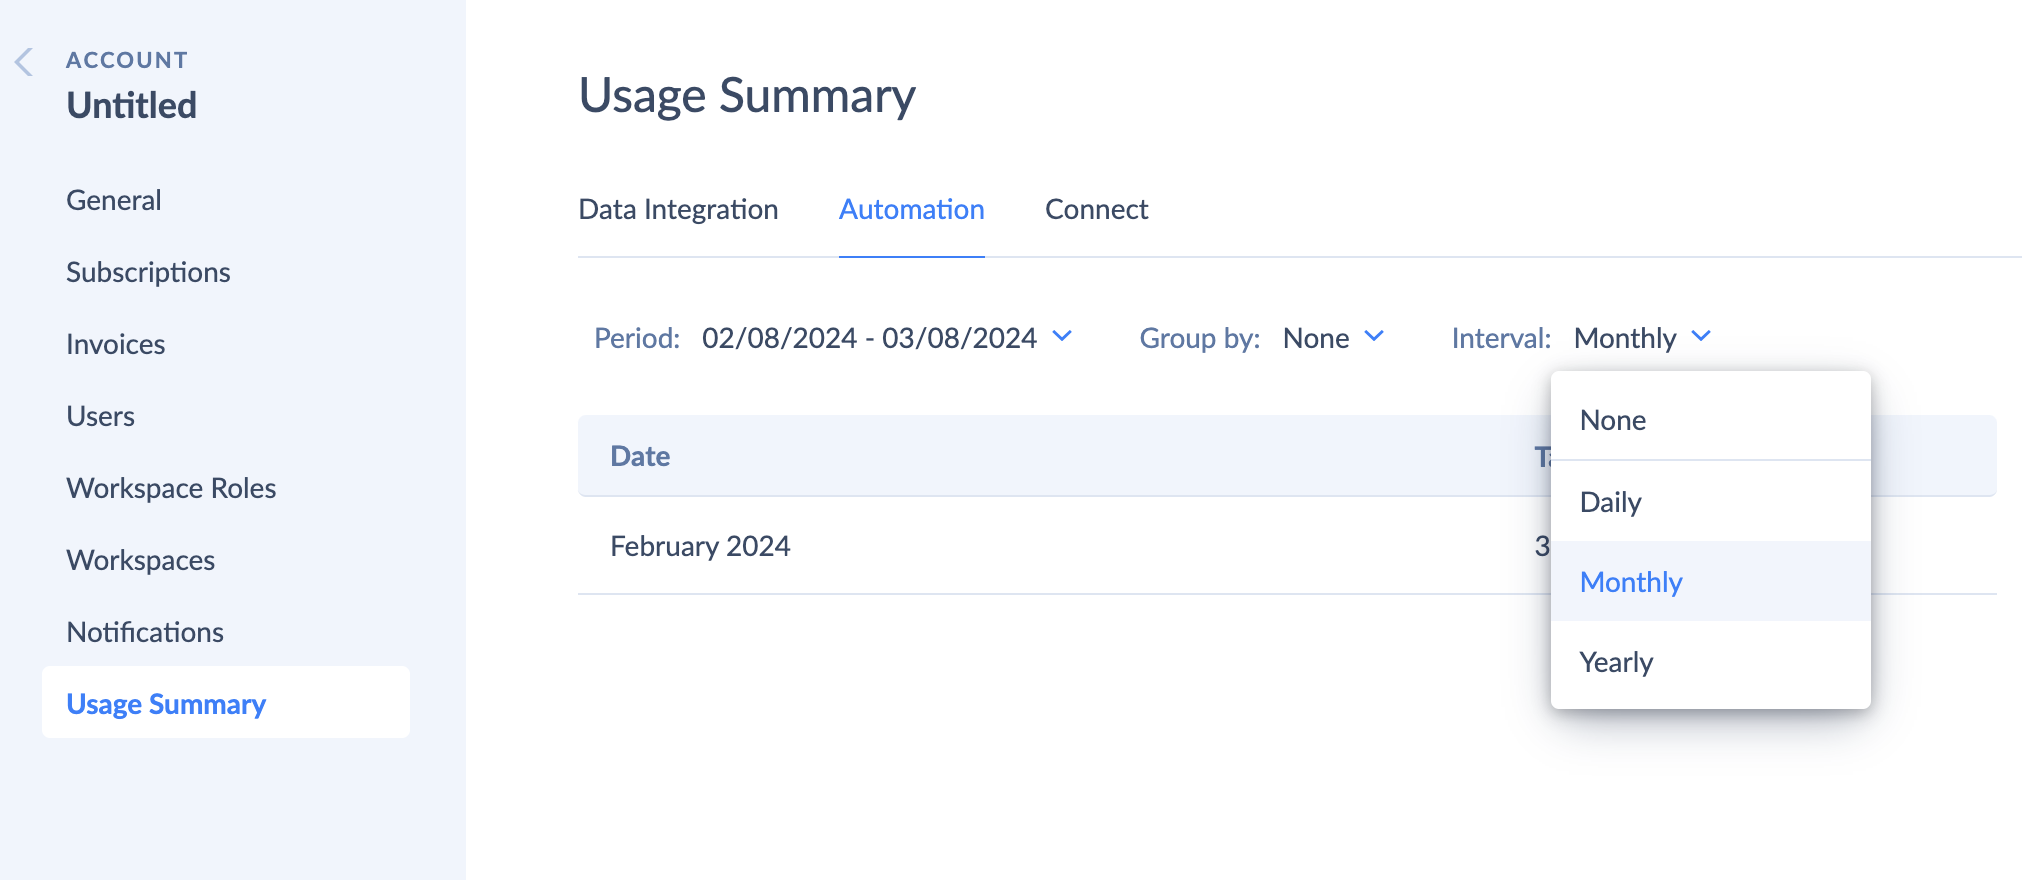
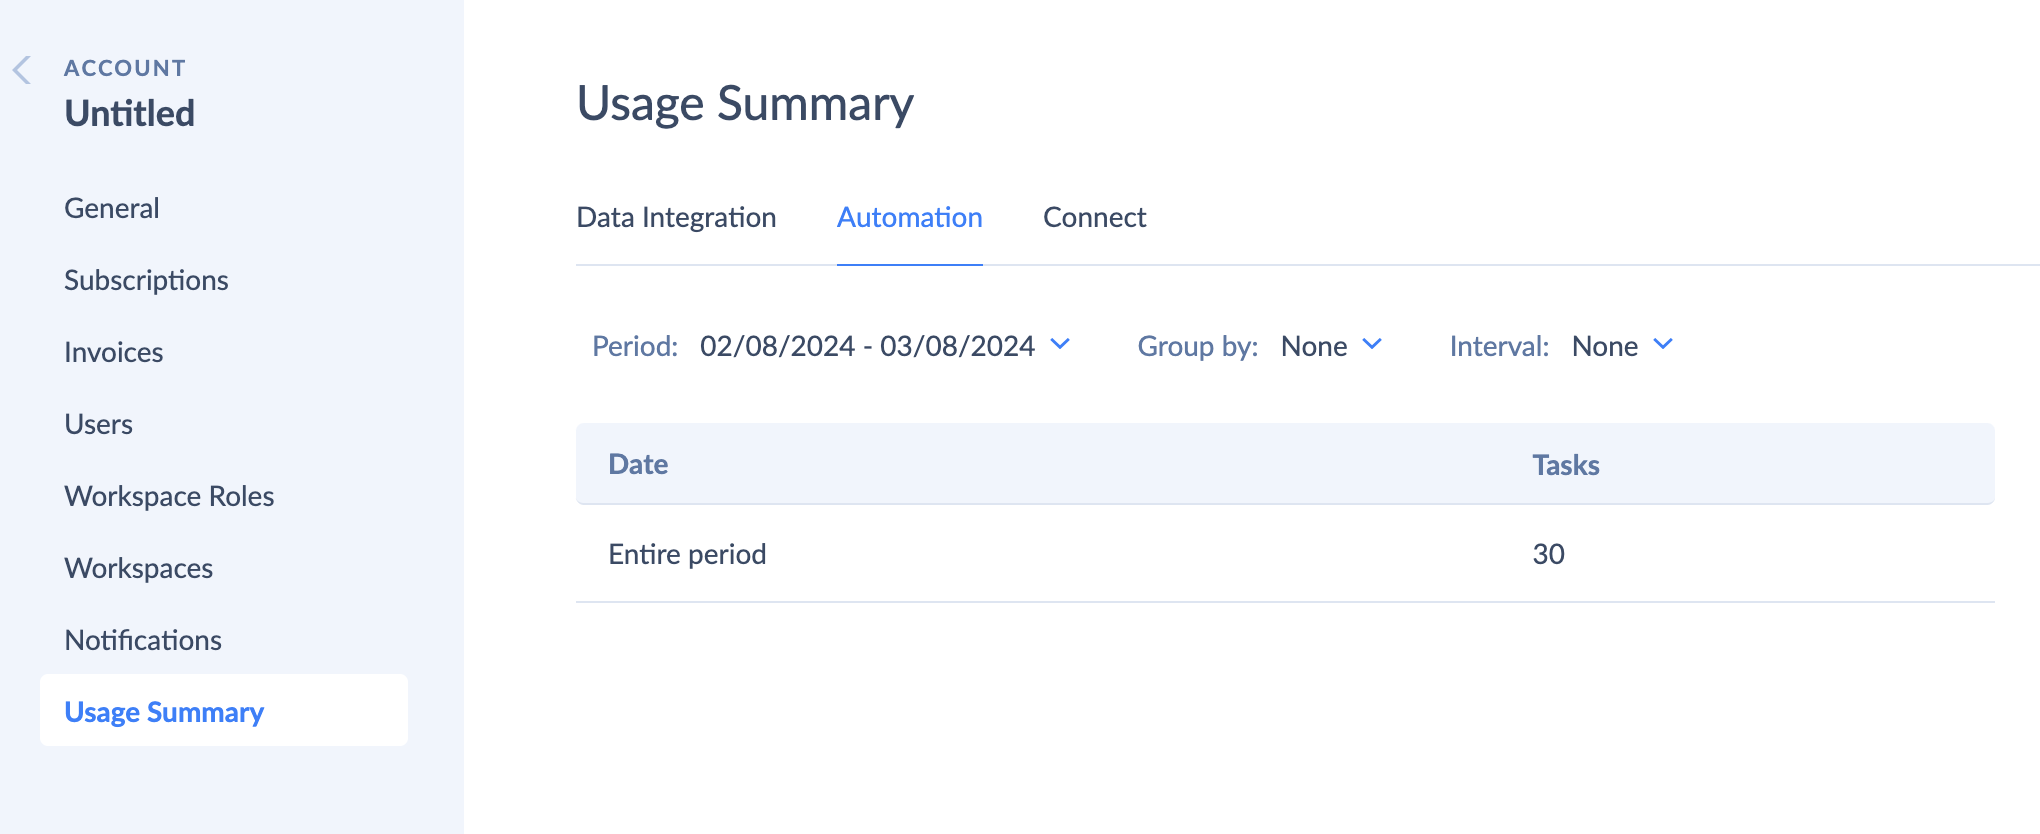
Breakdown by Interval
With Interval you can split the statistics by the selected value. Use Interval to get the used resources per specific day, month, or year. By default, the Interval value is set to None, and Skyvia displays the total value.