Monitoring Endpoint Activity
Skyvia allows you to view all the activity on your endpoints (all your data access and manipulation operations) as well as to view all users, their operations and from which IPs these operations are performed. You can also filter requests depending on their final result — failed, succeeded or all requests. Moreover, you can select different time periods to display your endpoint requests. To monitor your endpoint activity, click the Log tab in the toolbar and enjoy advanced functionality without any efforts.
Selecting a Period to Display Endpoint Requests
This tool is very useful for those clients who have high endpoint activity each day. It provides easier visual perception of the results and allows you to view a request history for a specified period of time.
You can set time periods to display your requests in the following way:
-
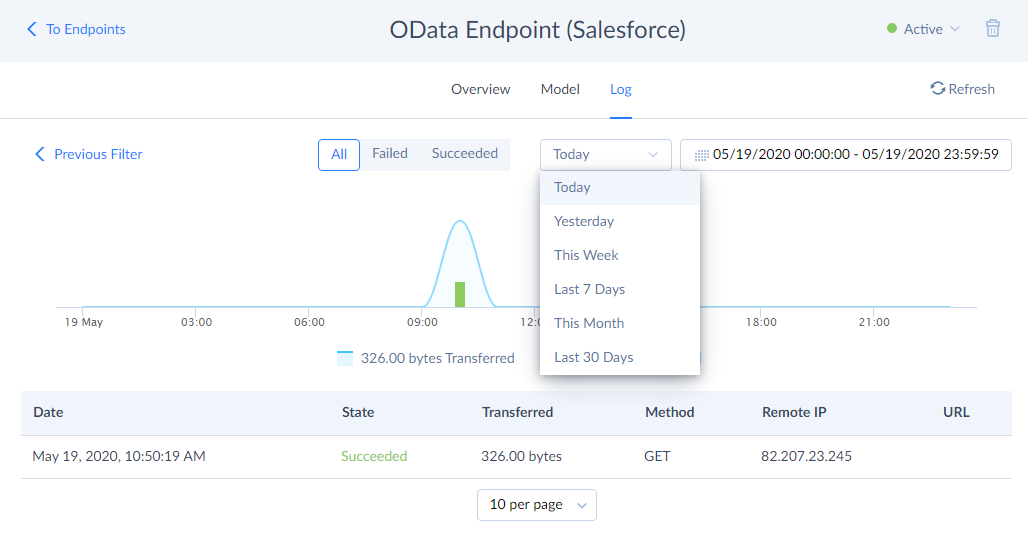
By clicking the Today list, which allows selecting a period from the available options. You can display requests for today or yesterday only, or select a longer display period — for the whole week/month, for the last 30 days.
-
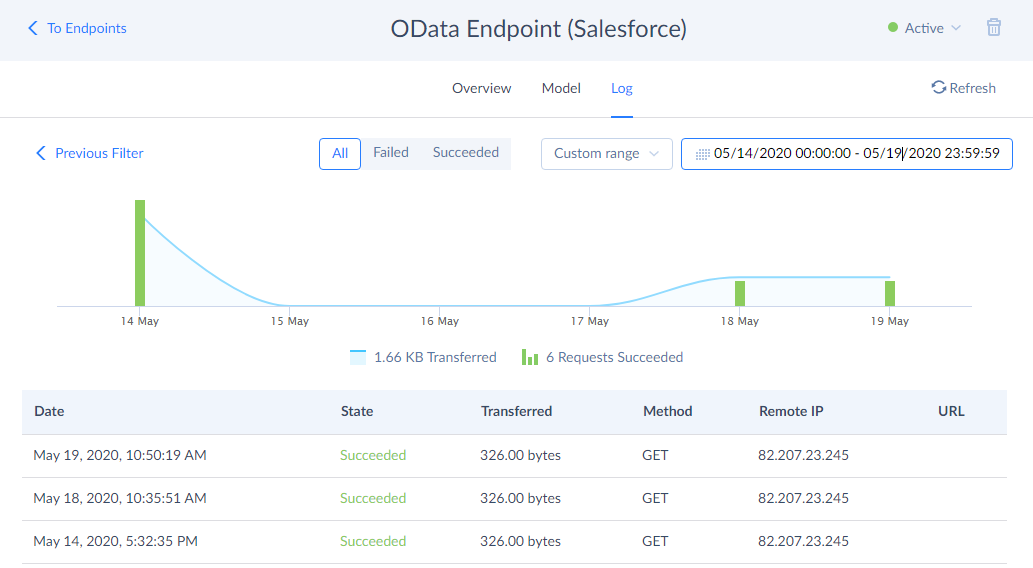
By clicking Calendar, which allows selecting any period you want. You can either select certain dates from the calendar or change the time period manually by entering the required dates in the box. We do not limit you, you are free to change any parameter in the box — year, month, day, even minutes or seconds.
Using the calendar, you can select days in the middle of the week, only weekends or select longer periods from several months to several years. For example, to specify a period of several month, navigate to the start date of the period you want to select by using the arrows at the top of the calendar to scroll through the months and click it. Then, in the same way, navigate to the end date of the necessary period and click the end date.
-
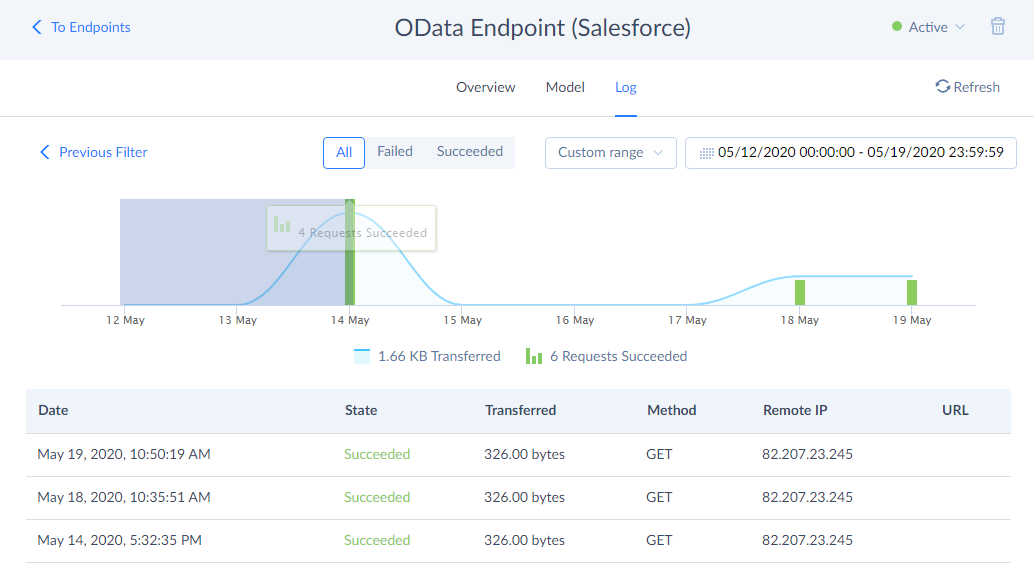
By selecting a time span on the timeline using the mouse pointer, which allows narrowing down the period in order to see the endpoint activity in more details. You can do it either by moving the mouse pointer along the time span and selecting the right interval or by clicking one of the activity bars on the chart. Clicking a bar displays only this certain period and splits days into hours, months into days, or years into months.
Filtering Endpoint Requests by Status (Succeeded, Failed or All)
On the Log tab, you can easily view all your endpoint requests filtered according to their result. For example, you can display only succeeded requests, only failed or all of them. To do it, click the Failed or Succeeded buttons at the top left corner of the page.
The All button displays all endpoint requests together in one place. To check how many requests were successful and how many failed within a day, hover over the corresponding bar in the bar chart, and the number of requests will be displayed. Successful requests are always highlighted in green, failed ones — in red.
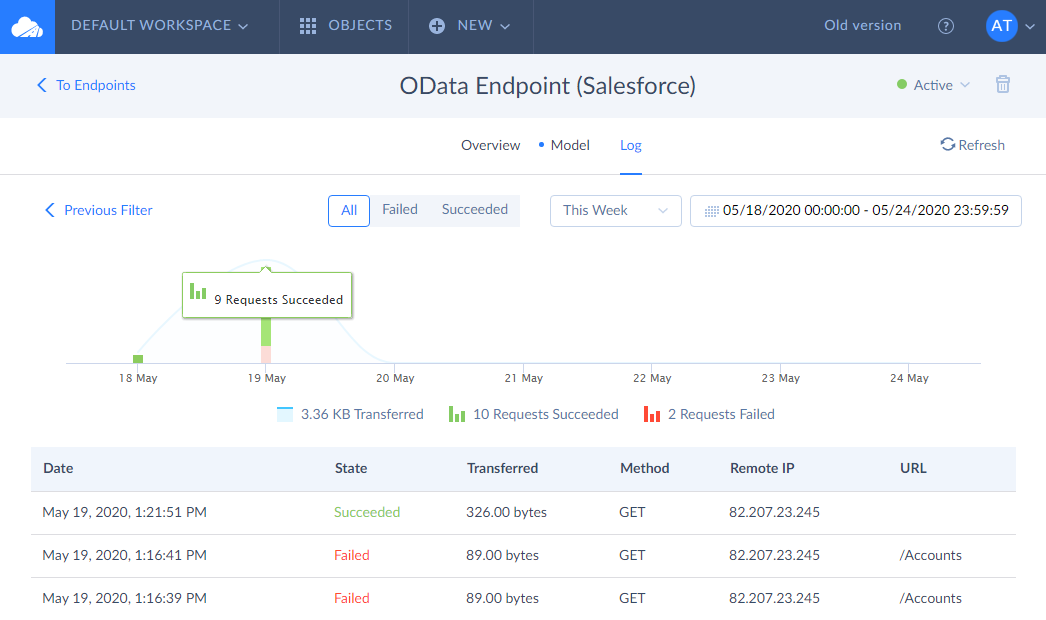
Information on Endpoint Requests
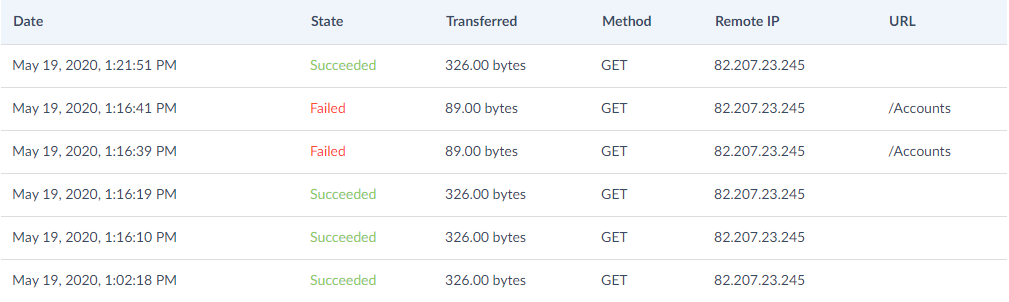
Detailed log contains a list of requests for the selected day or specified period. Detailed log is represented as a table with certain parameters under the bar chart and displays the following information for each request:
- Request date;
- Request status;
- Transferred bytes;
- HTTP request method;
- Remote IP address of the request;
- Accessed URL.
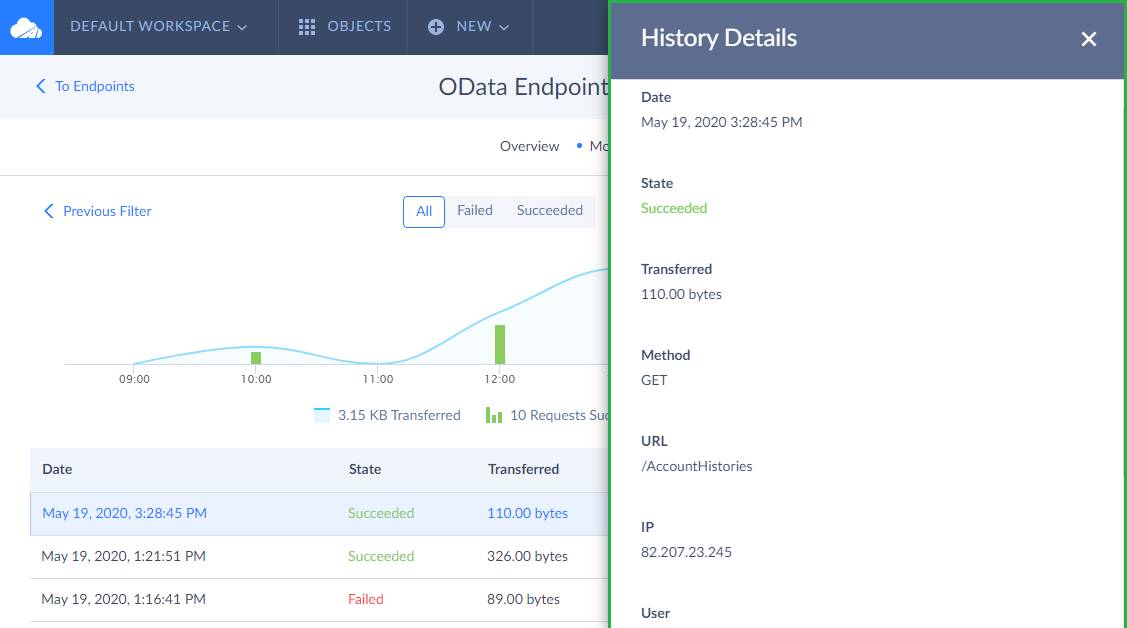
By clicking an exact endpoint request from the list, you open the History Details window with additional information, such as:
- User, who performed the request (if authentication is used for the endpoint);
- Request execution details, including data source access operations and SQL statements executed against the data source and the time these operations took (when applicable).