UI basics
In this topic, we showcase the automation product's main User Interface elements and describe how to interact with them.
Edit Mode
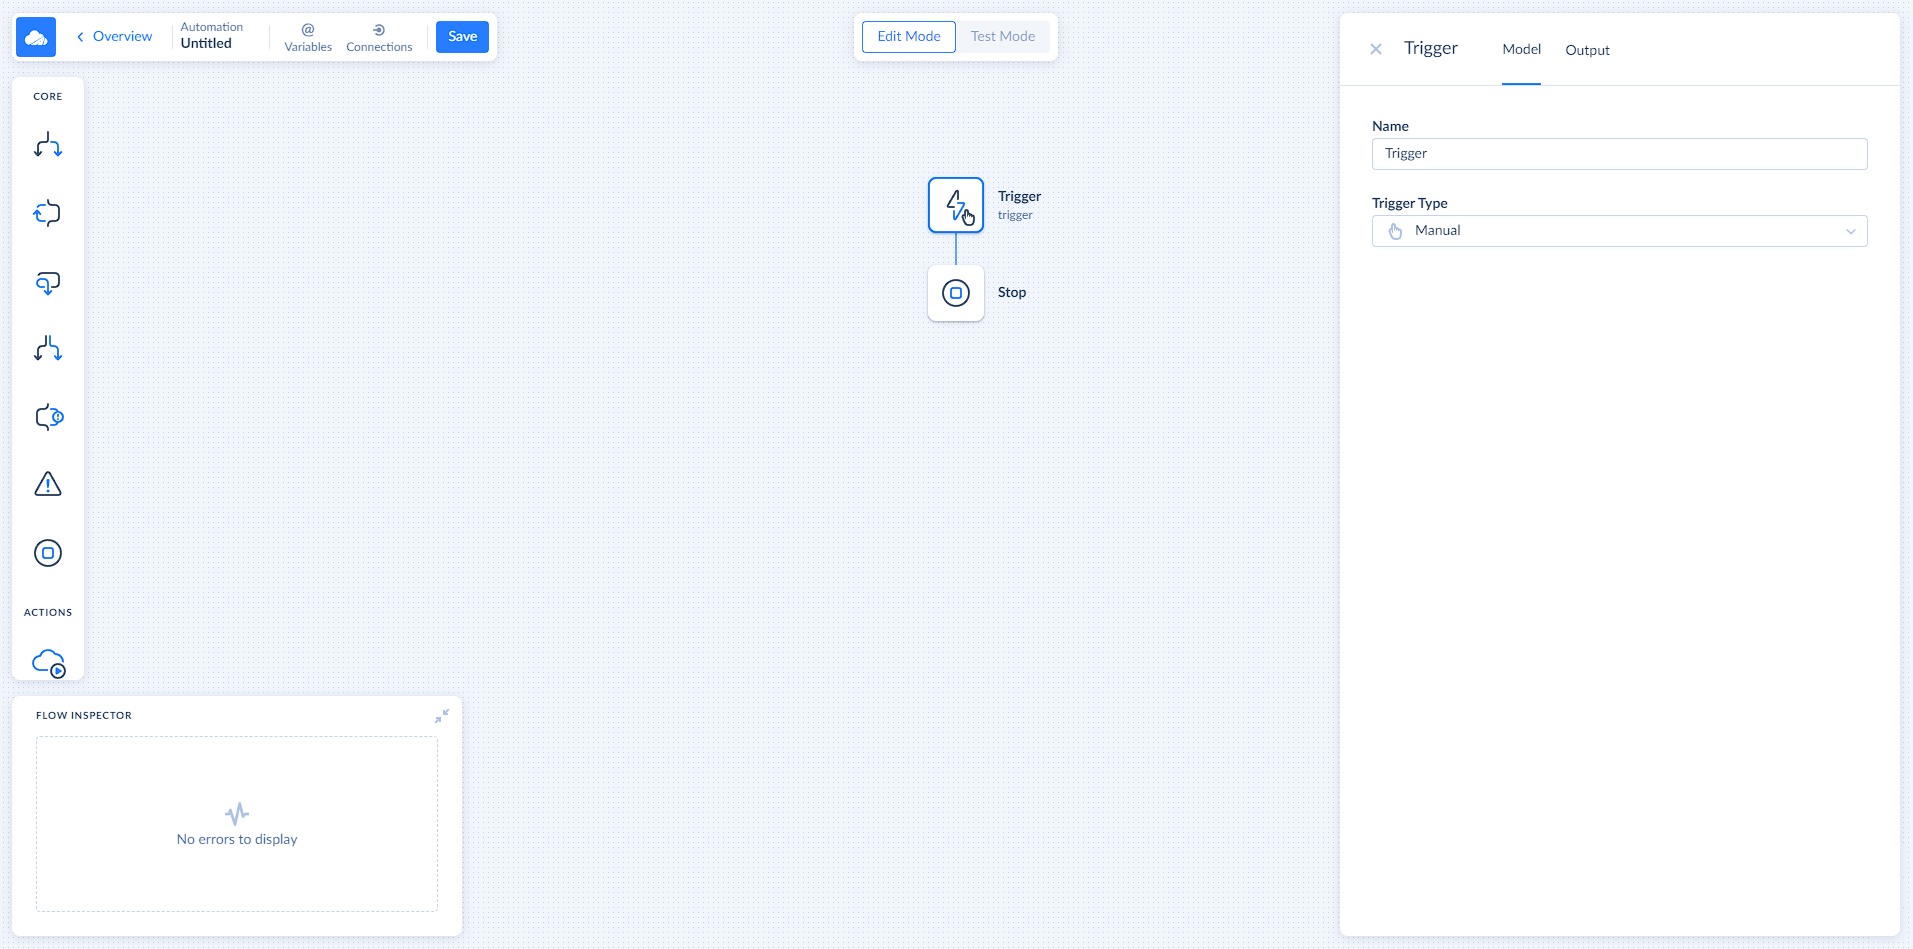
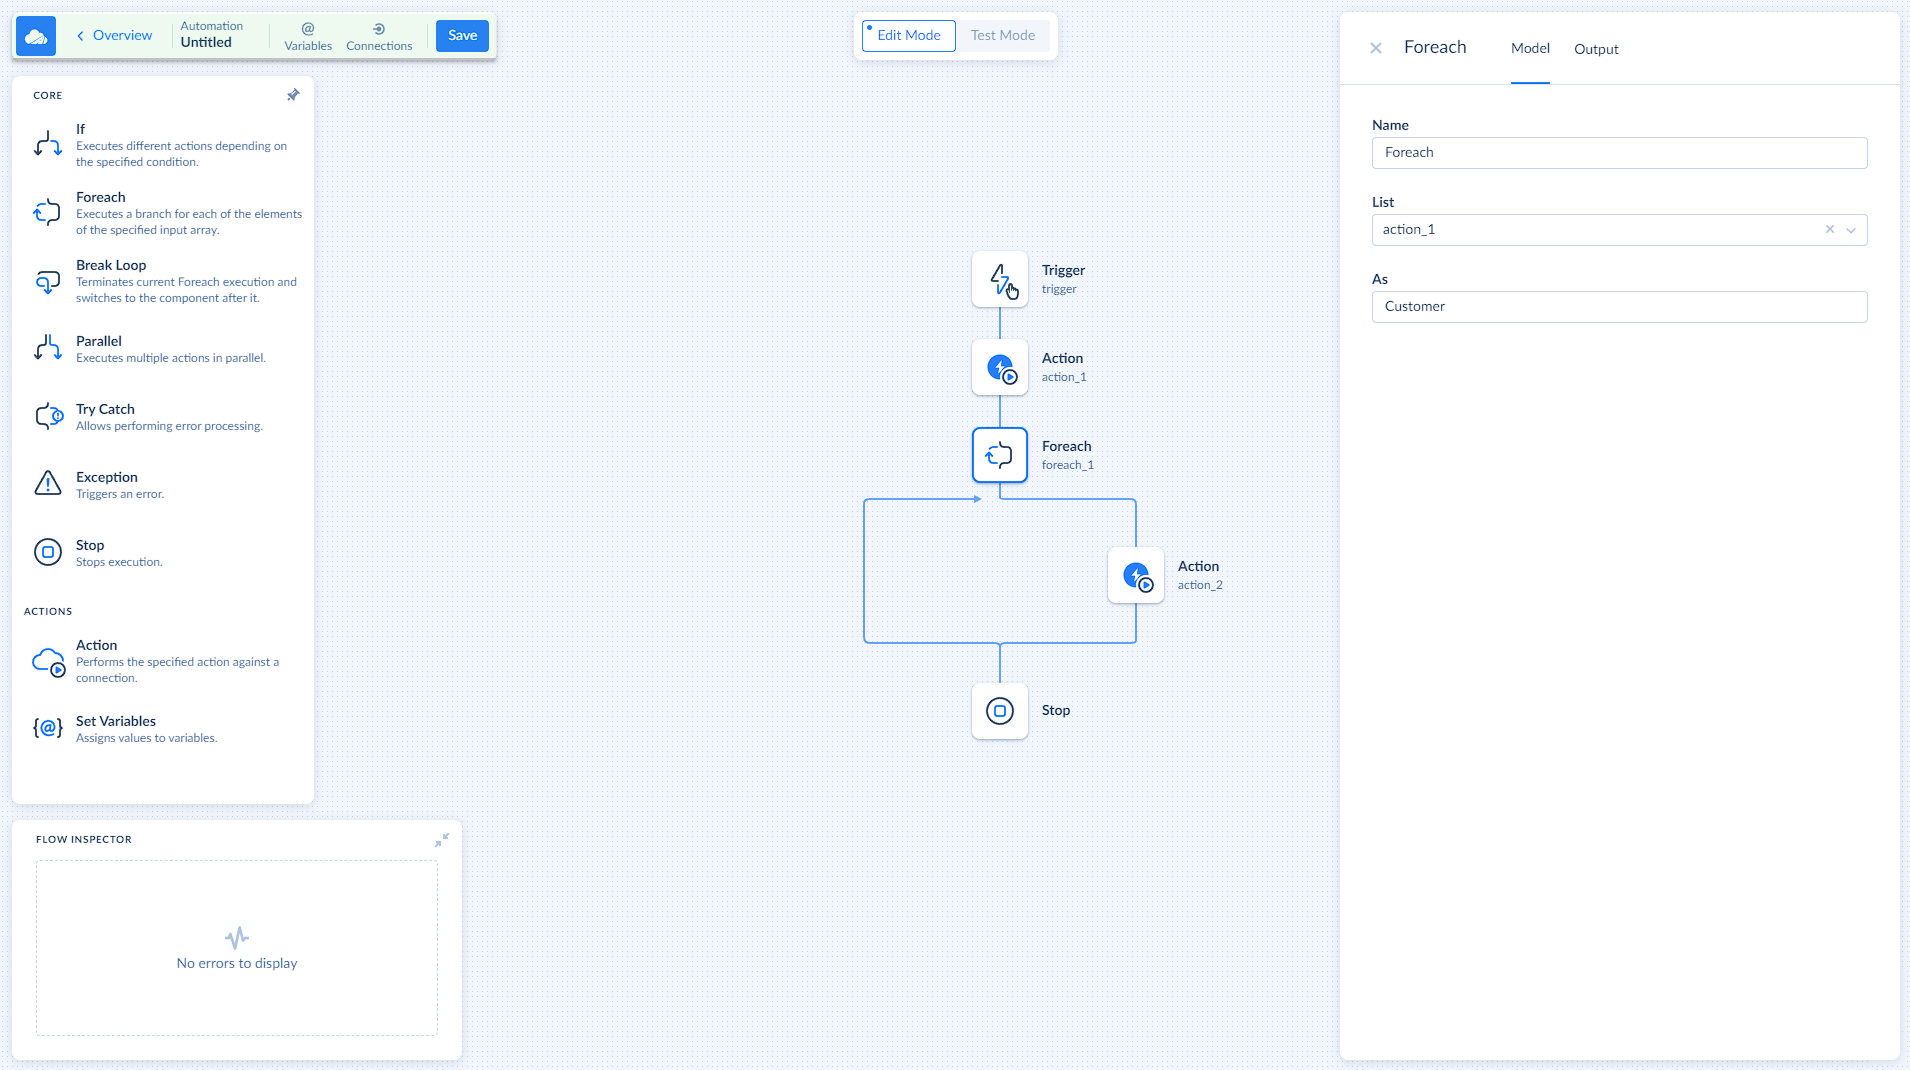
Edit mode is designed for building and editing your automation flow. Here you can access the tools and elements such as Components Pane, Automation Flow Diagram, Component Settings, Flow Inspector, and more. All of them are described in details below.
Components Pane
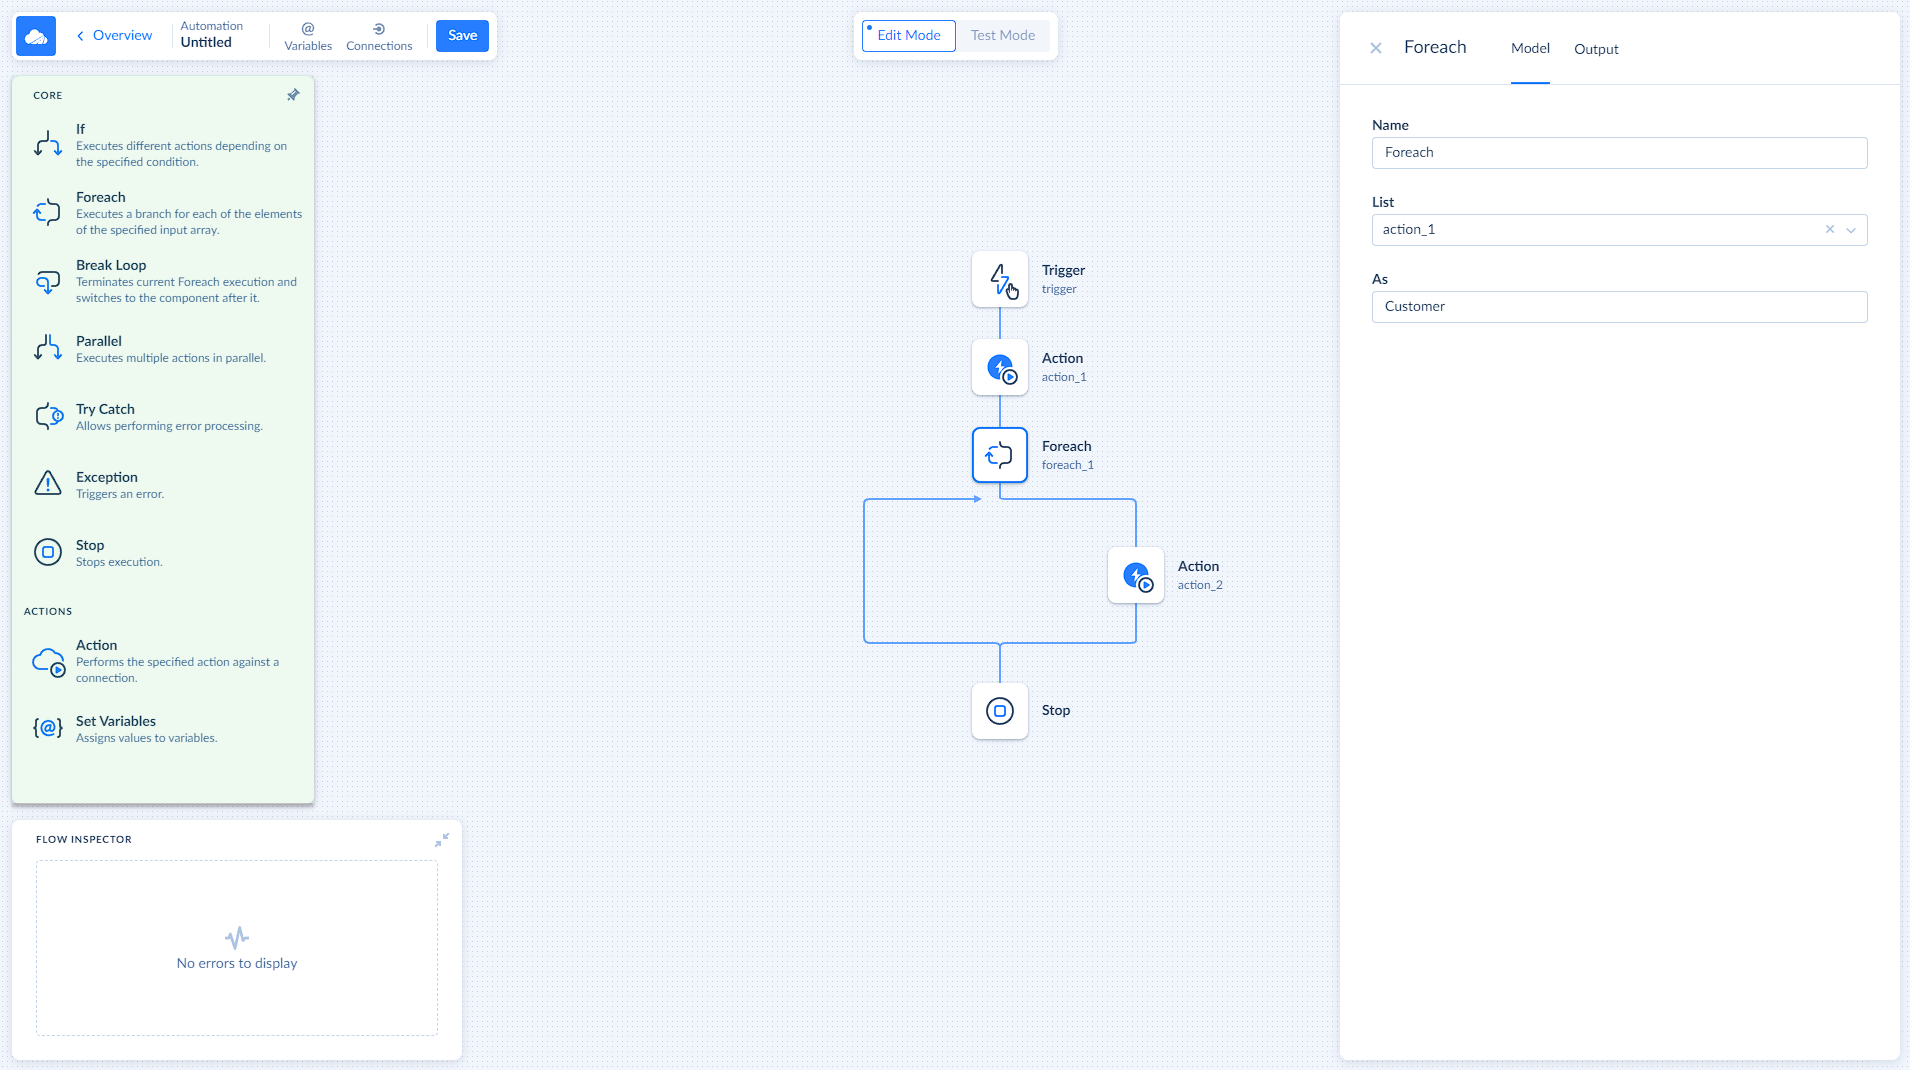
Components pane is located on the left. By default it shows you only the component icons to free up space for the Automation Flow diagram. To check the component's details hover your mouse over the Components pane. Components pane contains all the building blocks for you to create an automation flow. To add components to the automation flow, drag them from the components pane to your flow on the diagram. If you want to keep the detailed view of the components, click on the pin icon on the upper right.
Automation Flow Diagram
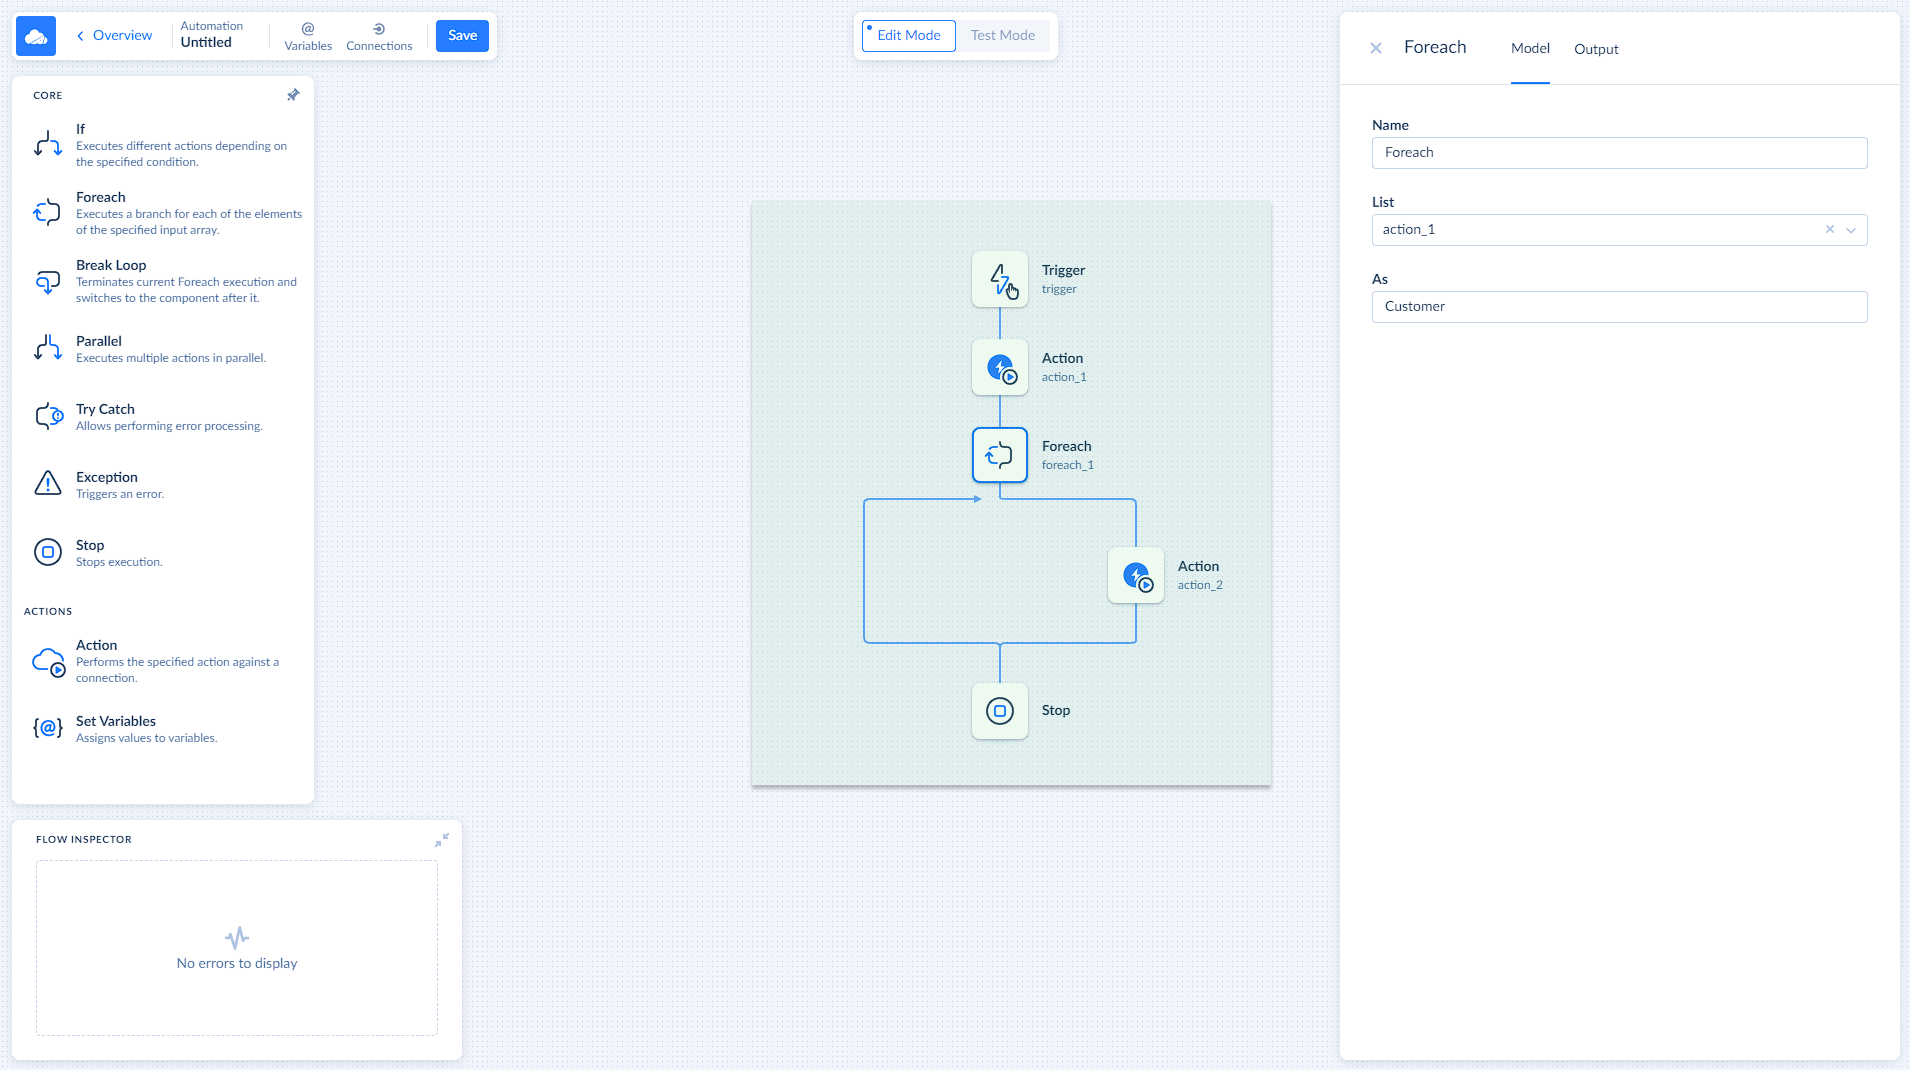
In the middle of the screen, you see a diagram with the automation flow. You can move around the diagram by clicking on any free spot and moving your mouse. You can zoom in and out using the + and - buttons. When you hover your mouse over a component, ... menu appears. Here you can choose to copy, paste, delete, or skip your component.
Component Settings
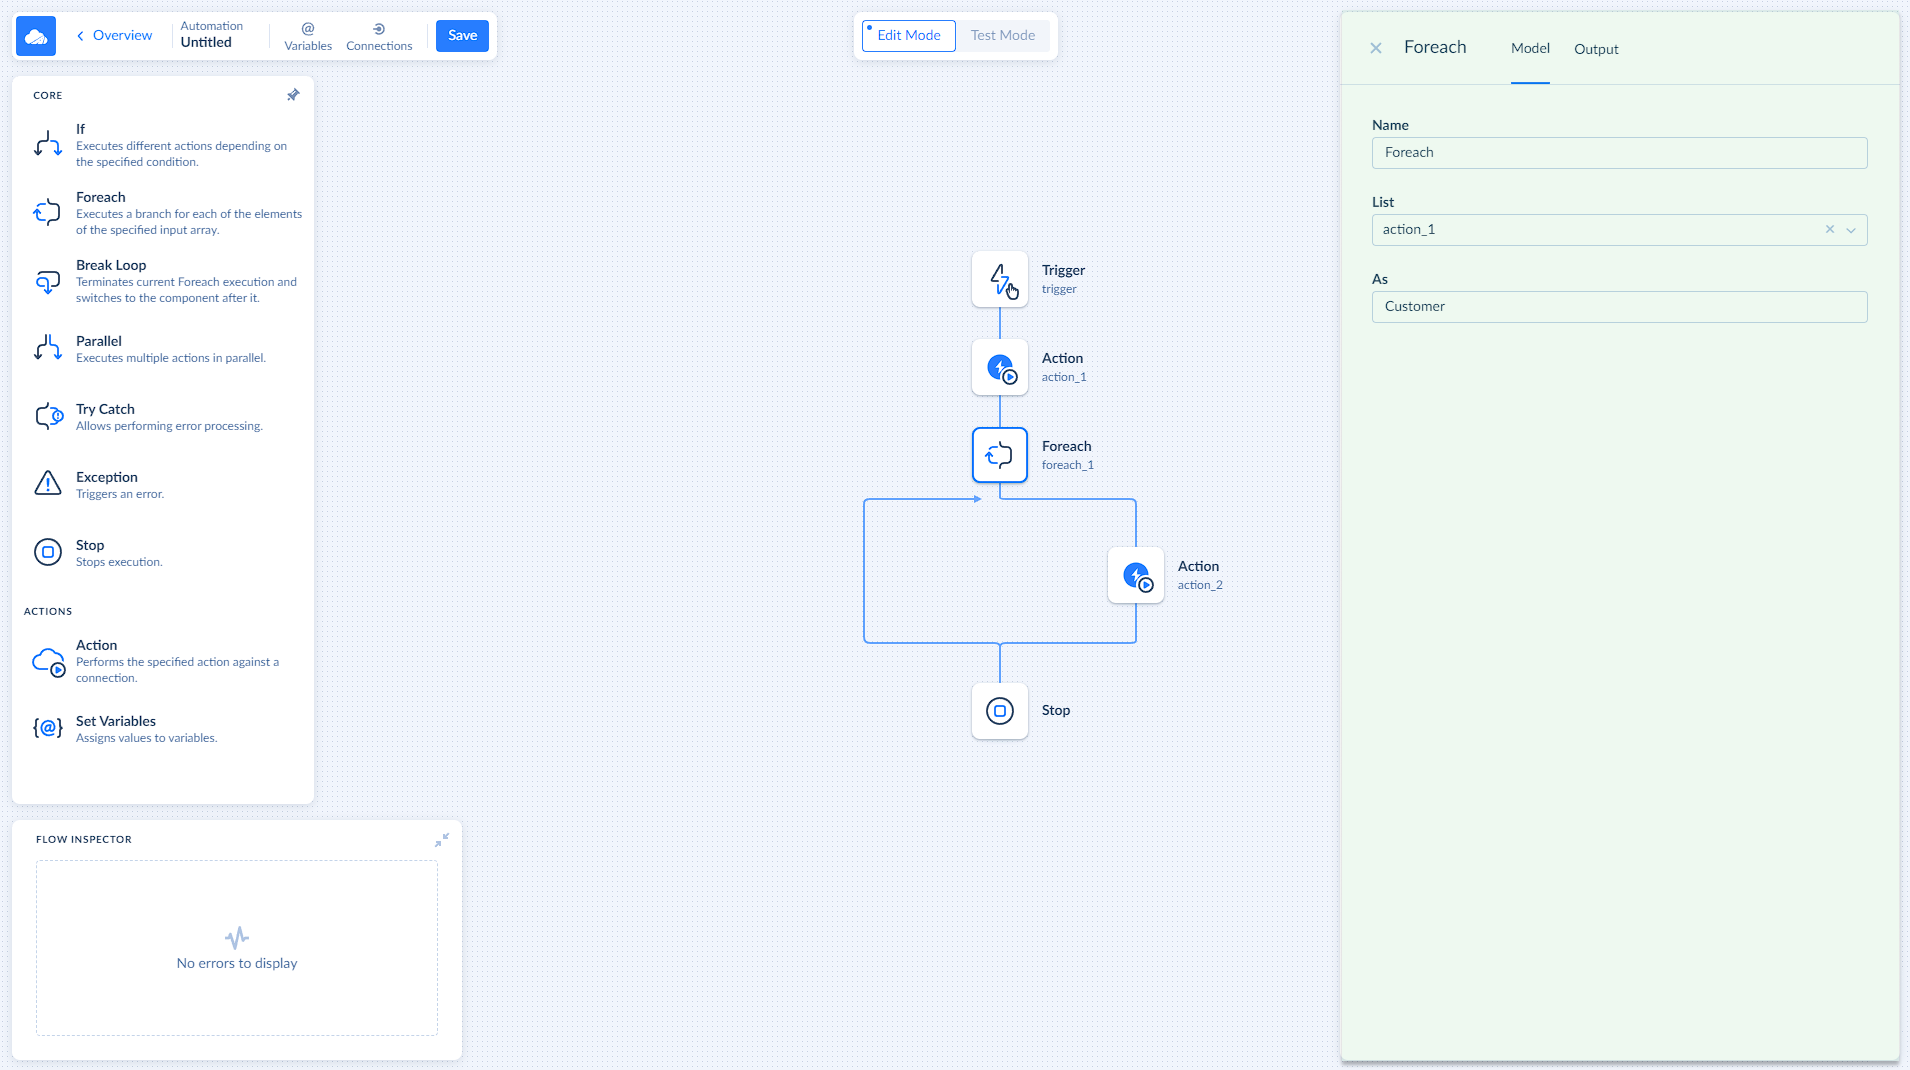
To access the component's settings, click on it on the automation flow diagram. Component Settings will appear on the right side of the screen. This pane is used to customize your components and can be used to select connections, choose actions, set conditions, and more. To learn about the settings of a specific component, visit the Components chapter.
Flow Inspector
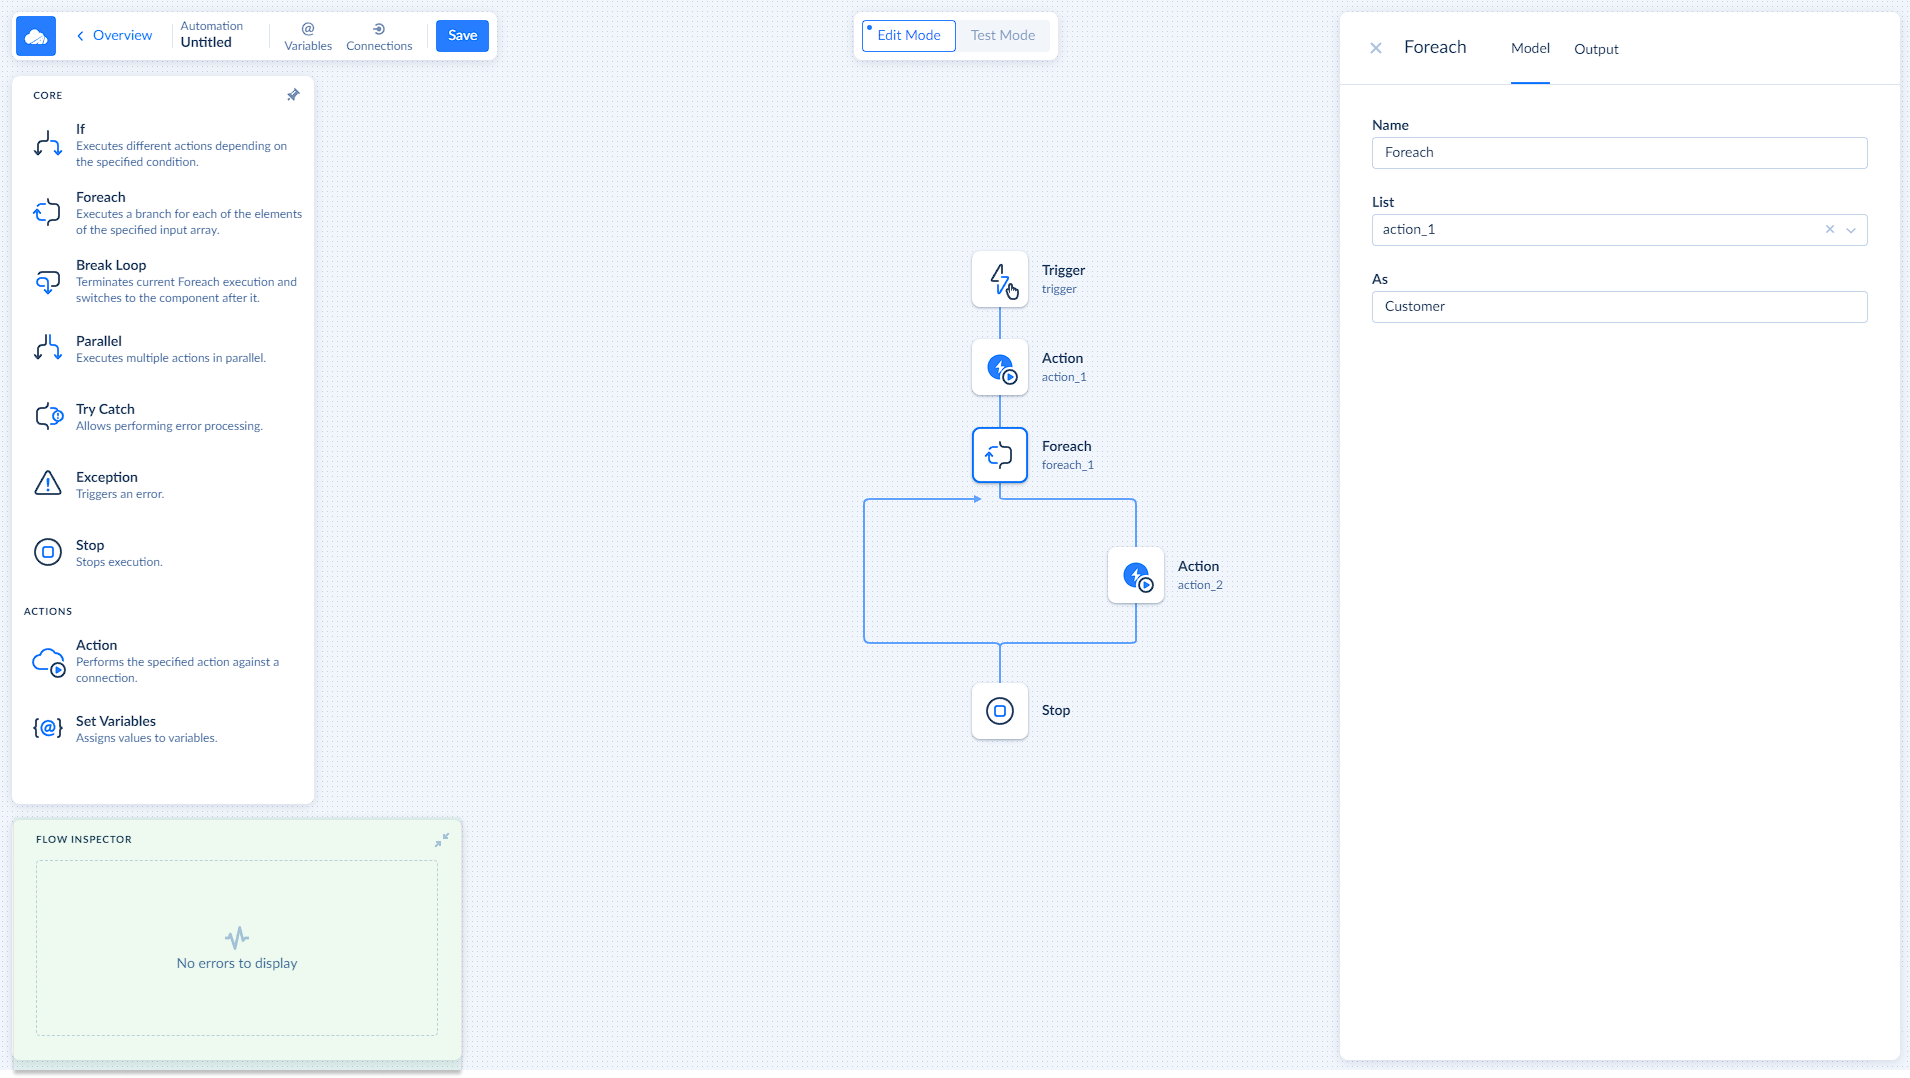
Flow inspector is located on the bottom left and designed to assist you with the real-time error tracking. If the error is found, it will be highlighted in the Flow Inspector alongside with the components name that is causing that error. Click on the component's name in the Flow Inspector to open its settings.
Top Menu Bar
Top Menu Bar allows you save the changes you've made in the Edit Mode, access the automation Overview page, manage Variables and Connections in your automation flow.
Overview
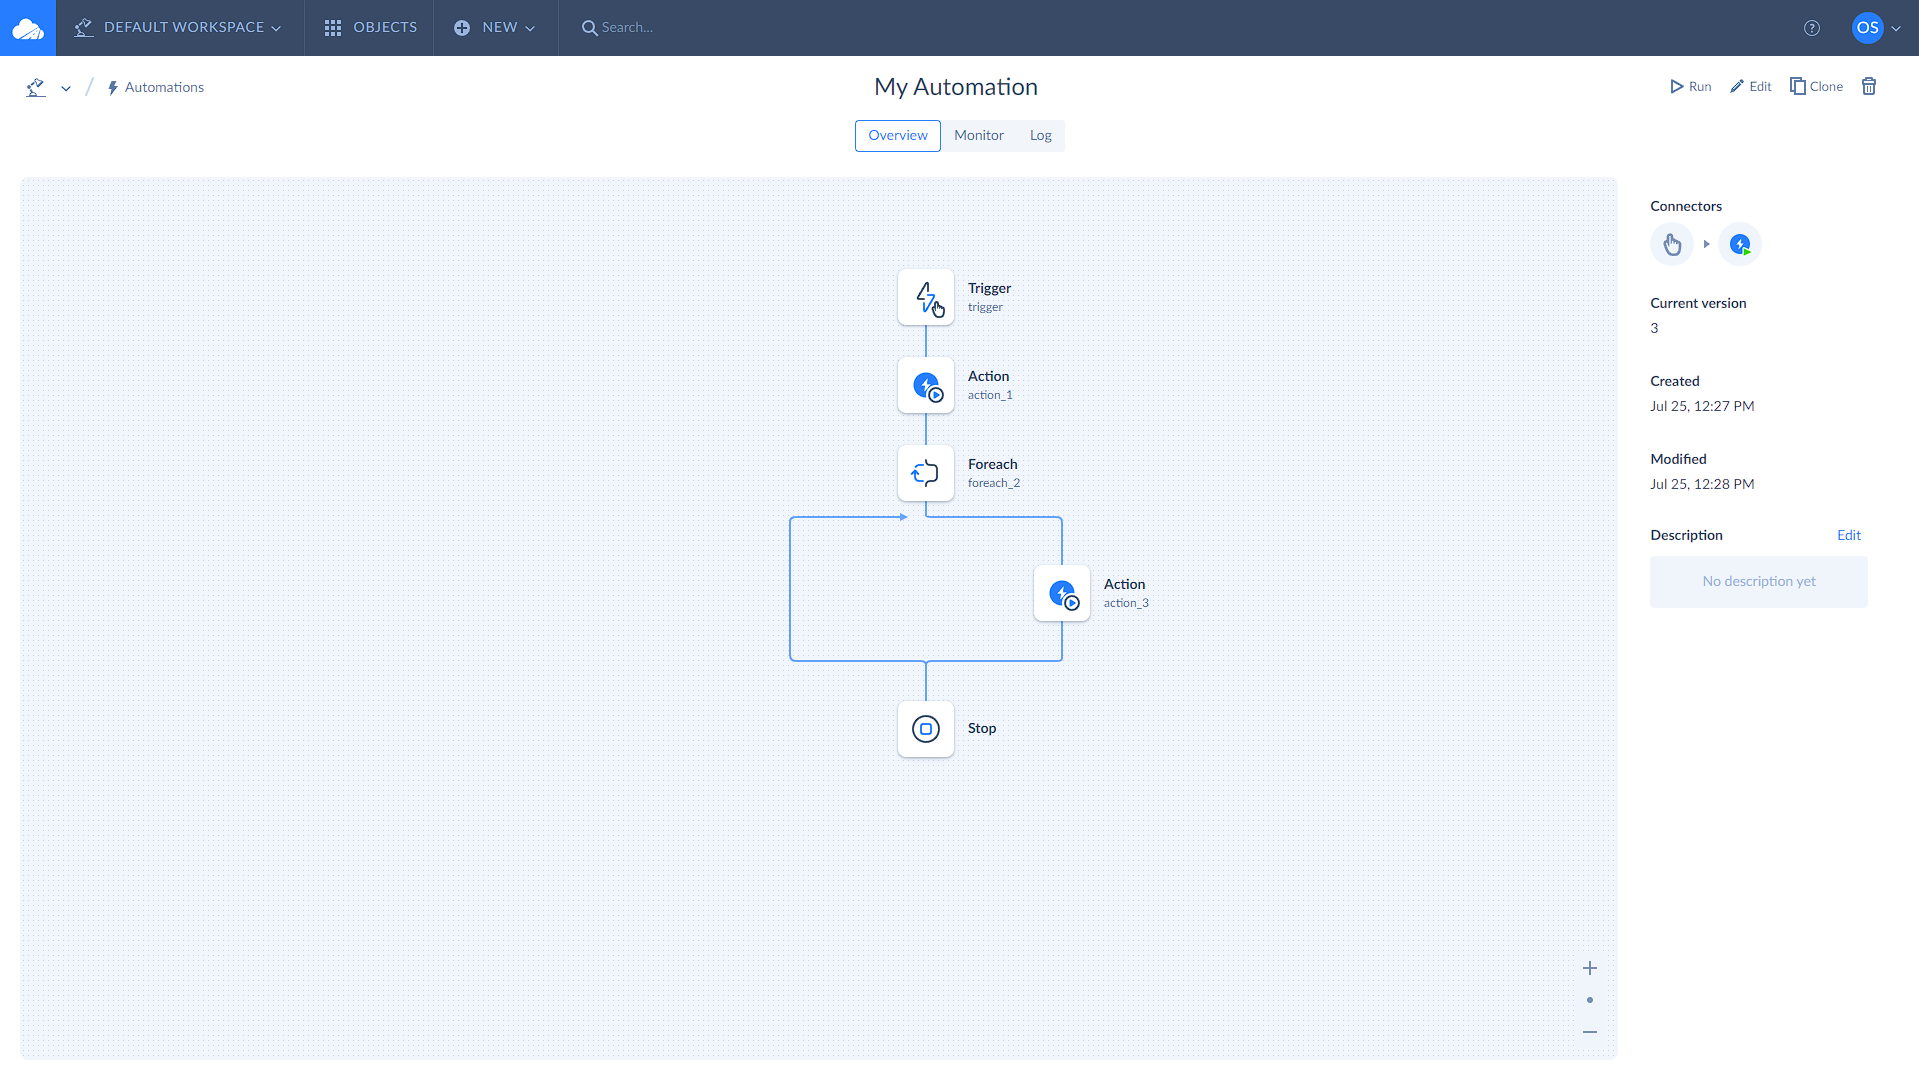
On the Overview page you can change the name of your automation, create a description for your automation and access Monitor and Log pages.