Monitoring Automation Executions
Once you created automation, it can be run manually or based on a specific event, depending on the trigger type used. Manual triggers require you to click Run to execute the automation. Connection, Schedule, and Webhook triggers execute the automation when a specific event occurs. Use the enable/disable toggler to start or stop checking for the trigger events.
To view the results and analyze details of the automation executions use Monitor and Log tabs.
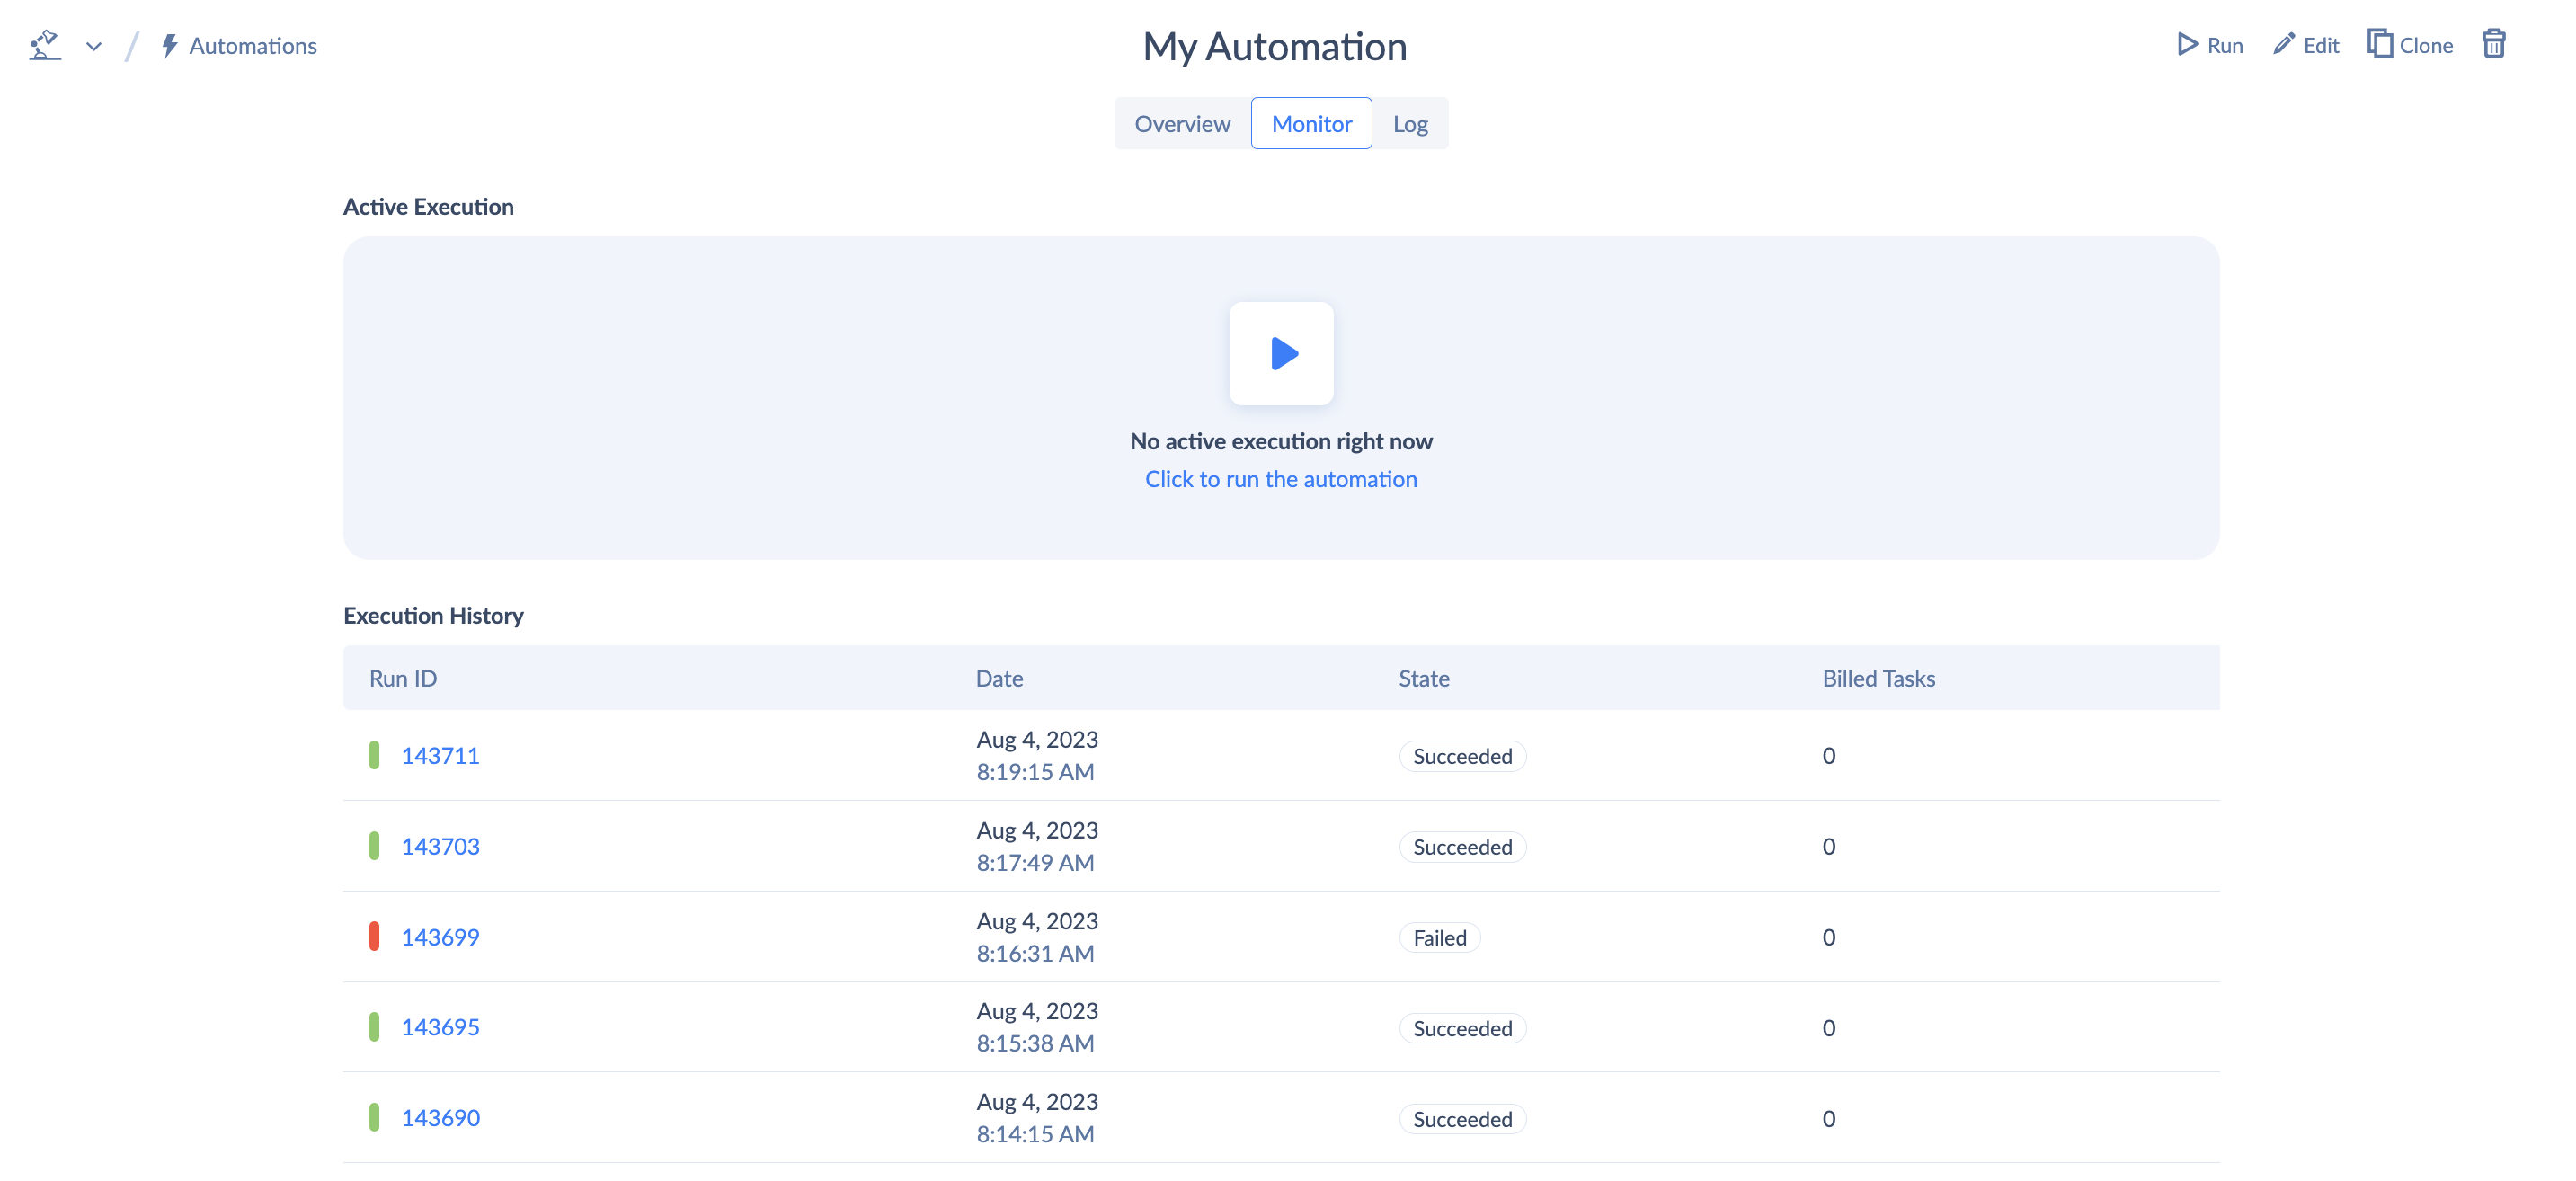
Monitor
You can check the results of the last five automation executions and the status of the current automation execution on the Monitor tab.
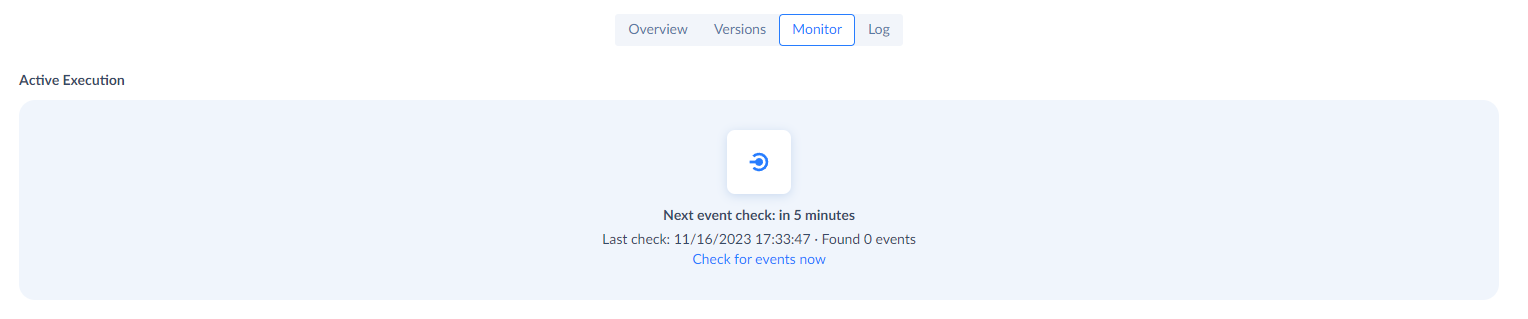
Monitoring Connection Triggers
If there are no active executions you will see the next event check timer. You can force Skyvia to check for events by clicking Check for events now.
If your Automation is enabled but the connection is no longer valid, you will receive an error message and an additional email notification.
If no events were detected after the check, the timer resets according to the trigger's polling interval value. If events were detected, Skyvia creates a queued execution for each detected event, and runs them one by one. Monitor tab provides you with the Execution ID, State, and the number of the queued executions. Here you can cancel the the current execution and discard the queued ones.
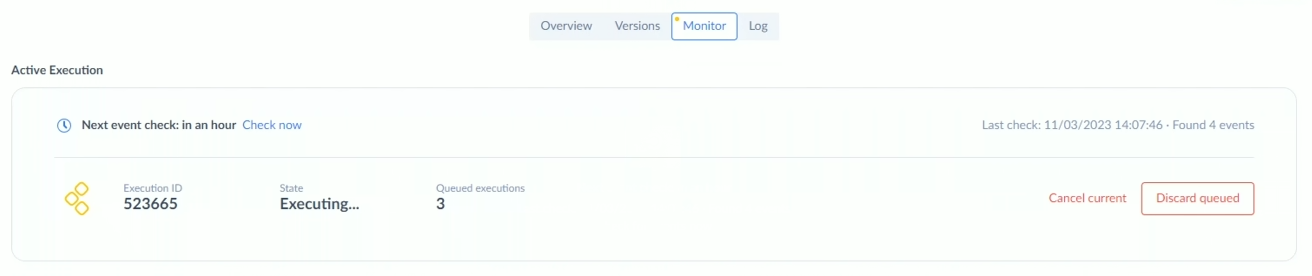
When you disable the automation, it saves the executions queue. When you restart the automation it starts with the queued execution on which you stopped before. The lifespan of the queued executions is 60 days. You can discard queued executions at any point by clicking discard queued.
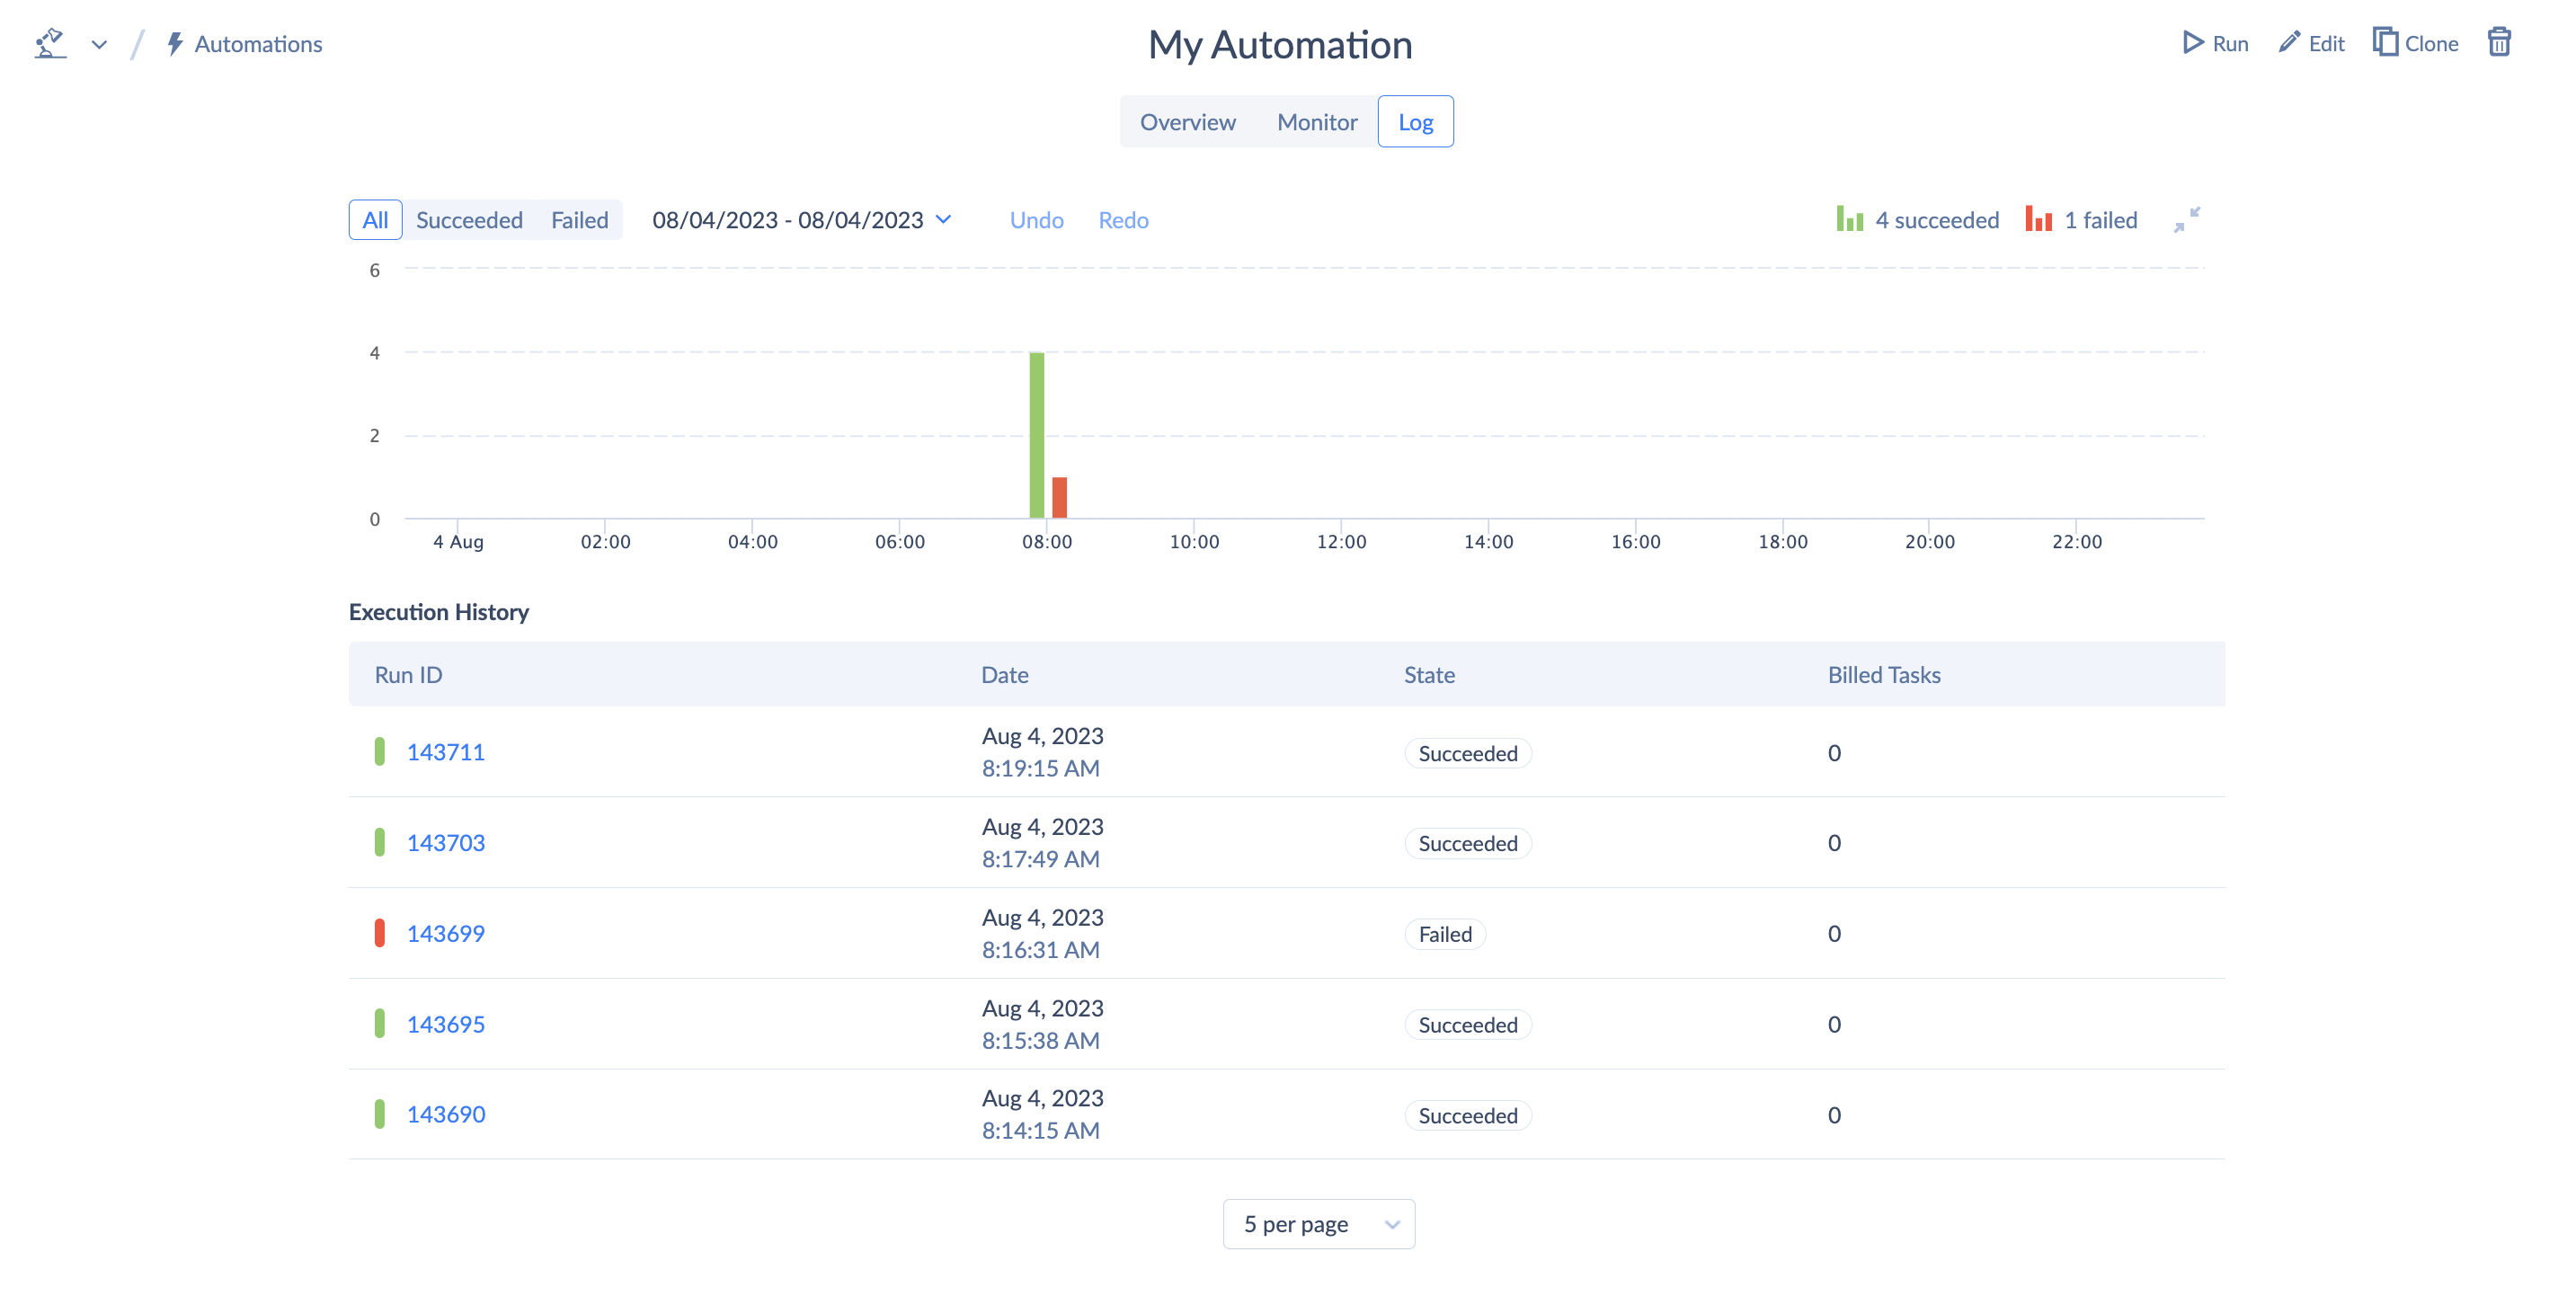
Log
To check all the completed automation executions, use the Log tab. Here you can apply filters by date and state.
Execution Details
To check the automation execution details, select the preferred execution from the list on either Monitor or Log tab.
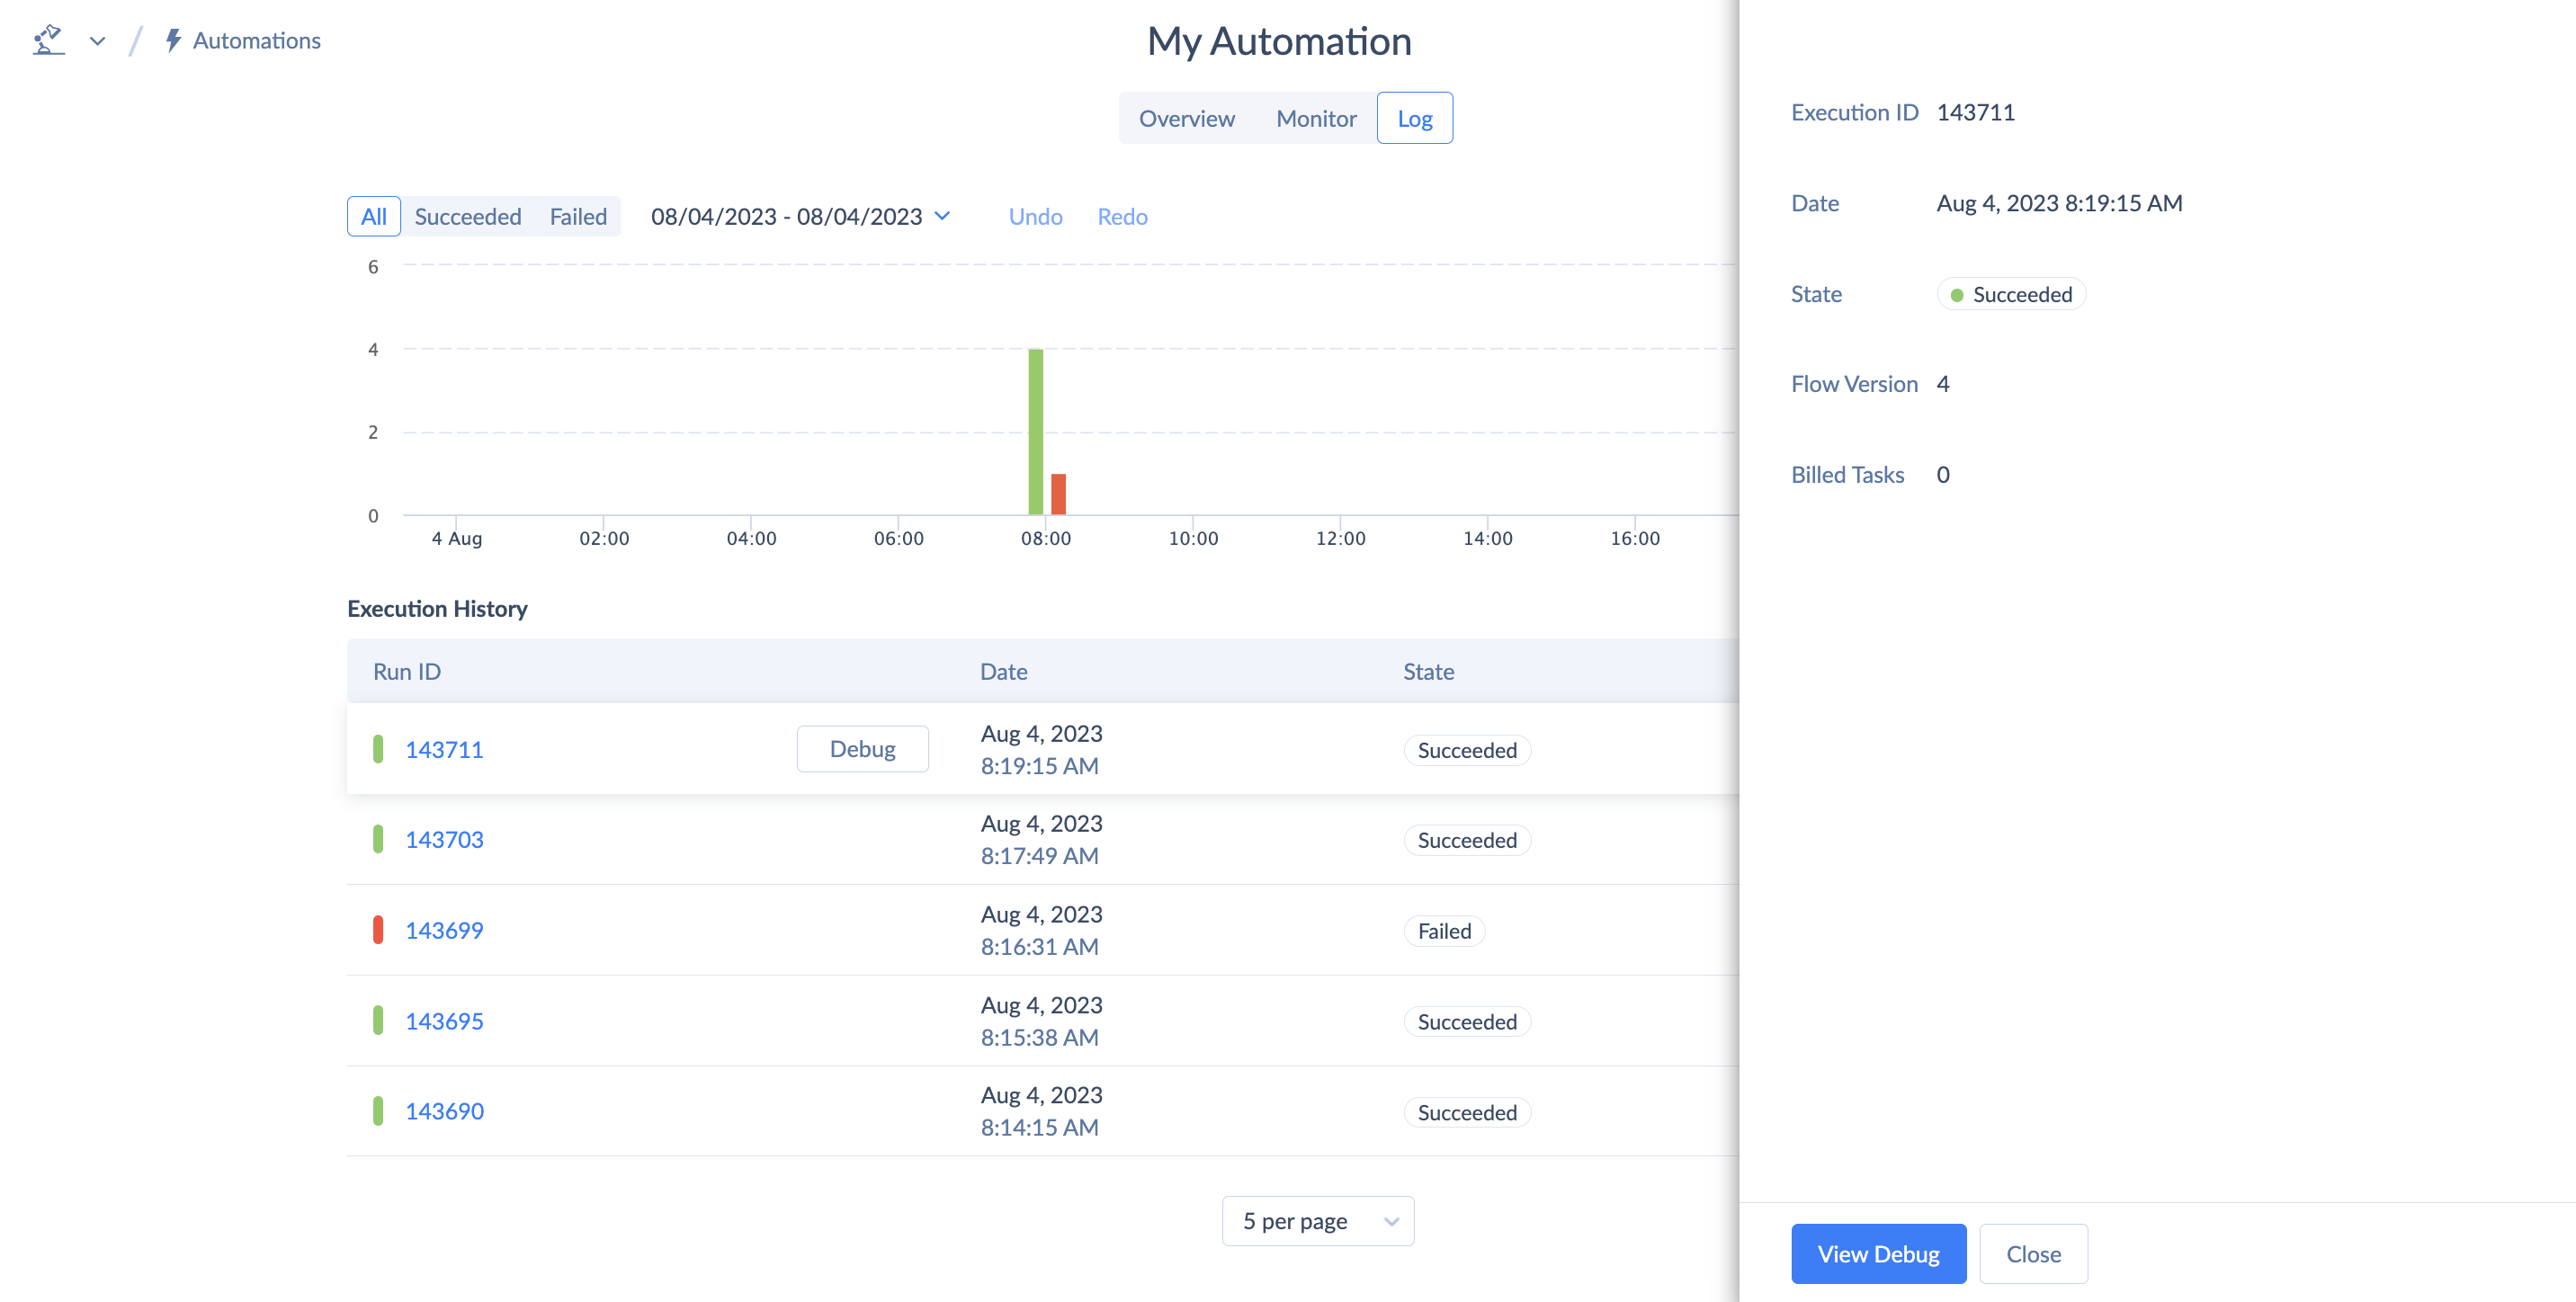
Details pane provides an access to the following infomation:
| Detail | Description |
|---|---|
| Execution ID | Unique identifier of the automation execution in Skyvia. |
| Date | Date and time of the automation execution. |
| State | State of the automation. Possible values: Executing, Succeeded, Failed, Cancelling, Canceled. |
| Flow Version | The version of the automation flow. Goes up in number each time you save changes to your automation. |
| Billed Tasks | The number of tasks used during the automation execution. |
| Error | If an error occurred during the automation execution, the error message will be displayed here. |
Each execution has its state. You can check it on the Details pane or in the list of executions on the Log and Monitor tabs.
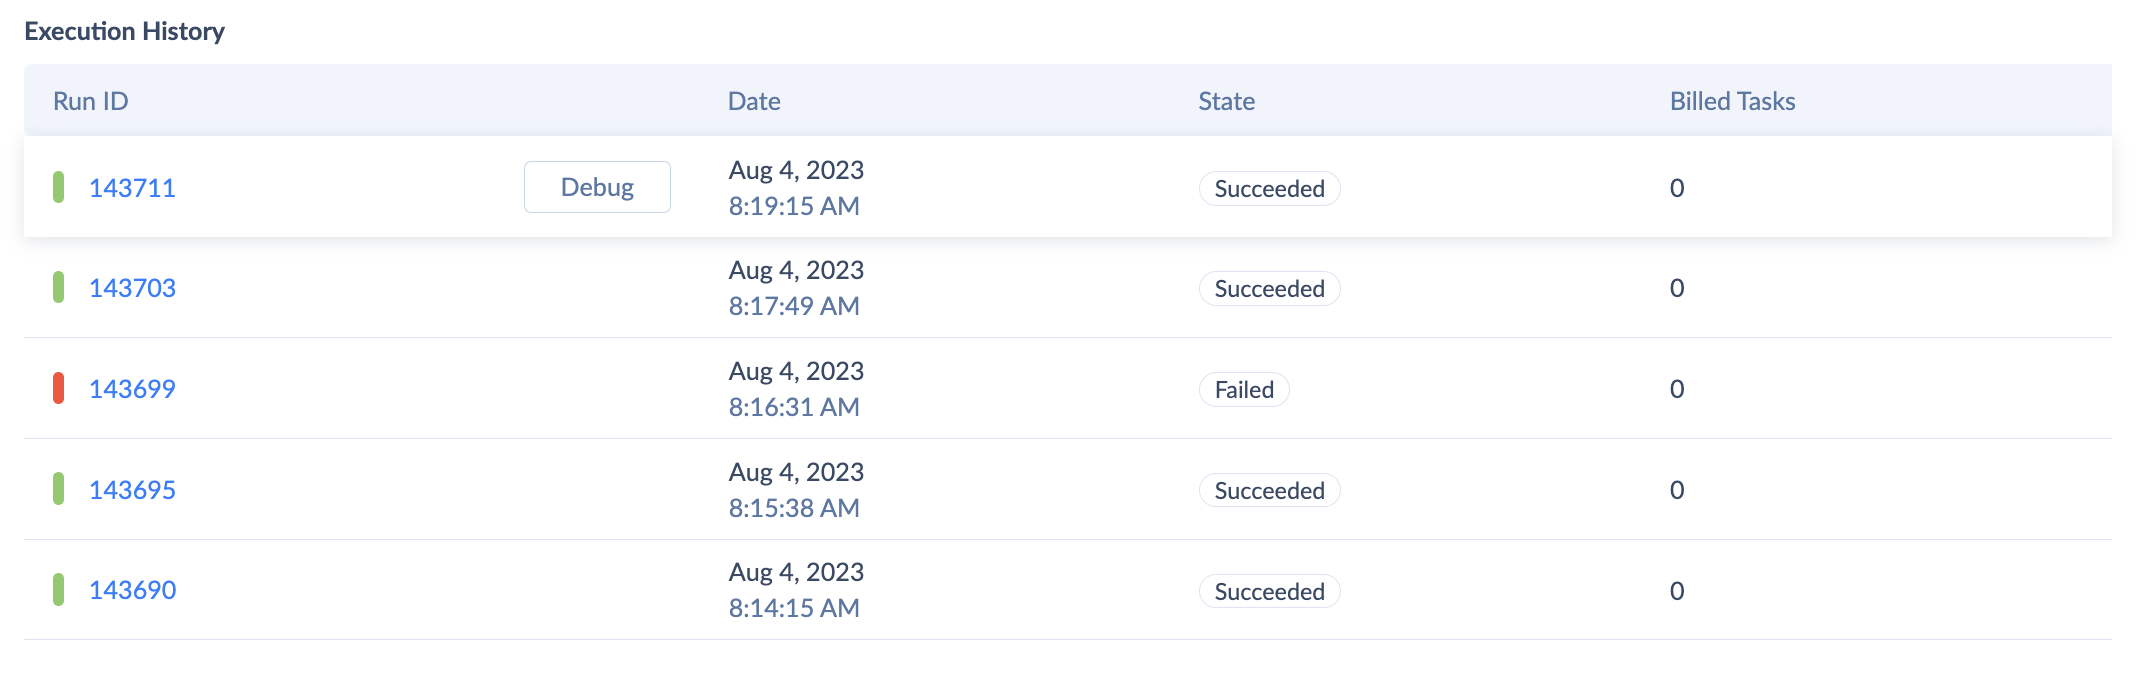
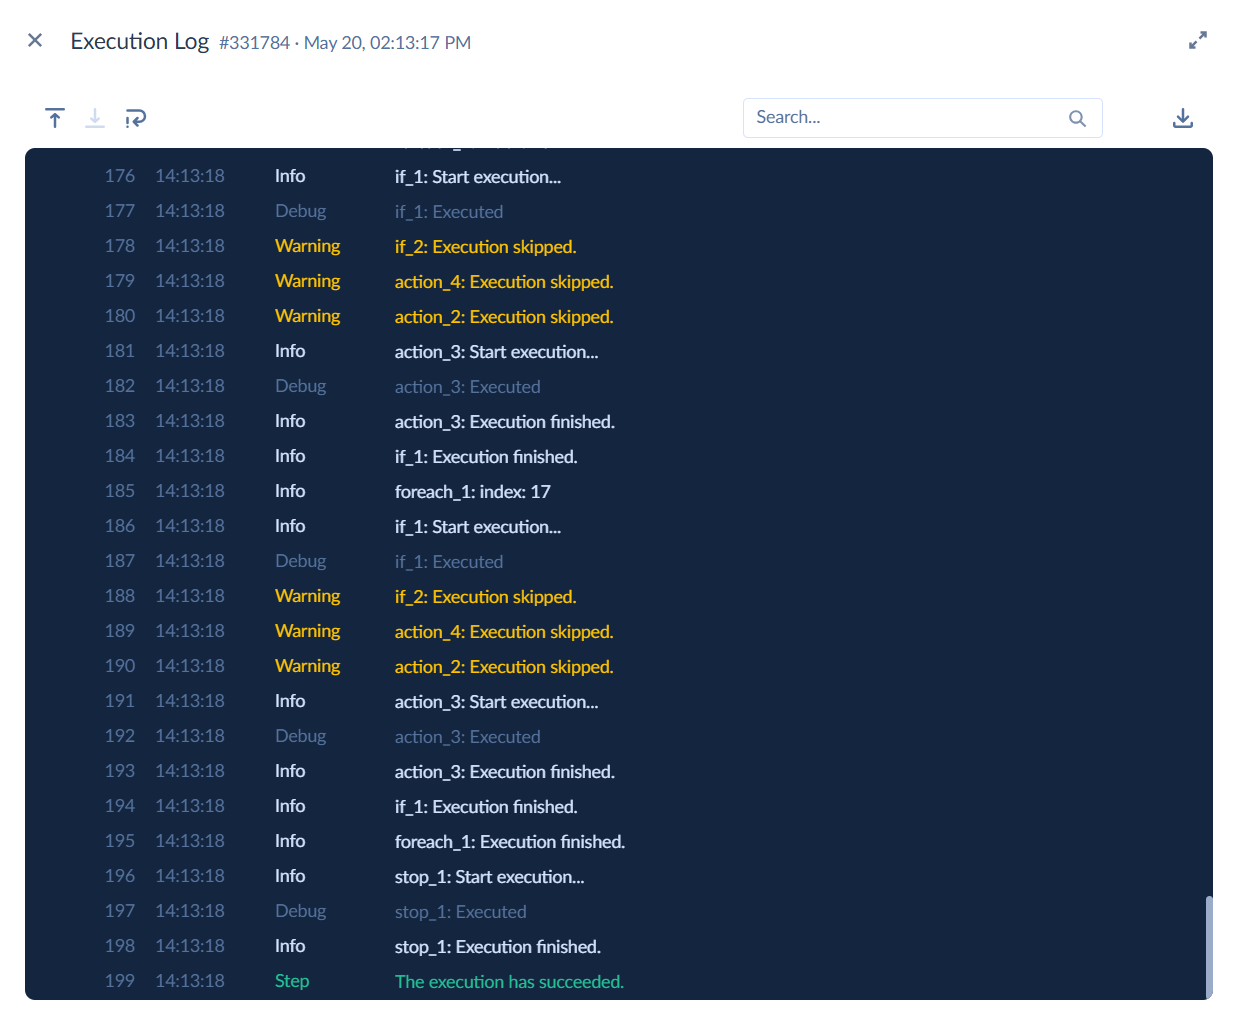
To open the execution log, click Log on the execution record. You can use search inside log records and download the raw log file.
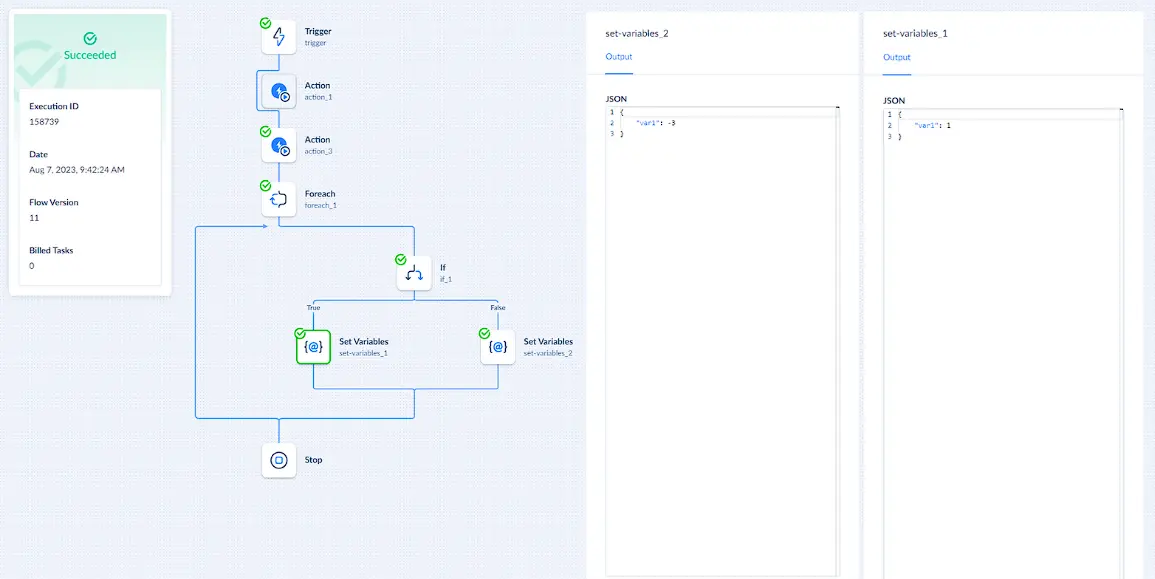
Debug Viewer
Debug Viewer enables you to check the automation execution at any point of the automation flow. Use it to check for errors in a specific component and to check the component's Input and Output data values.
Components with errors are highlighted in red , components without errors are highlighted in green , disabled and skipped components are highlighted in grey .
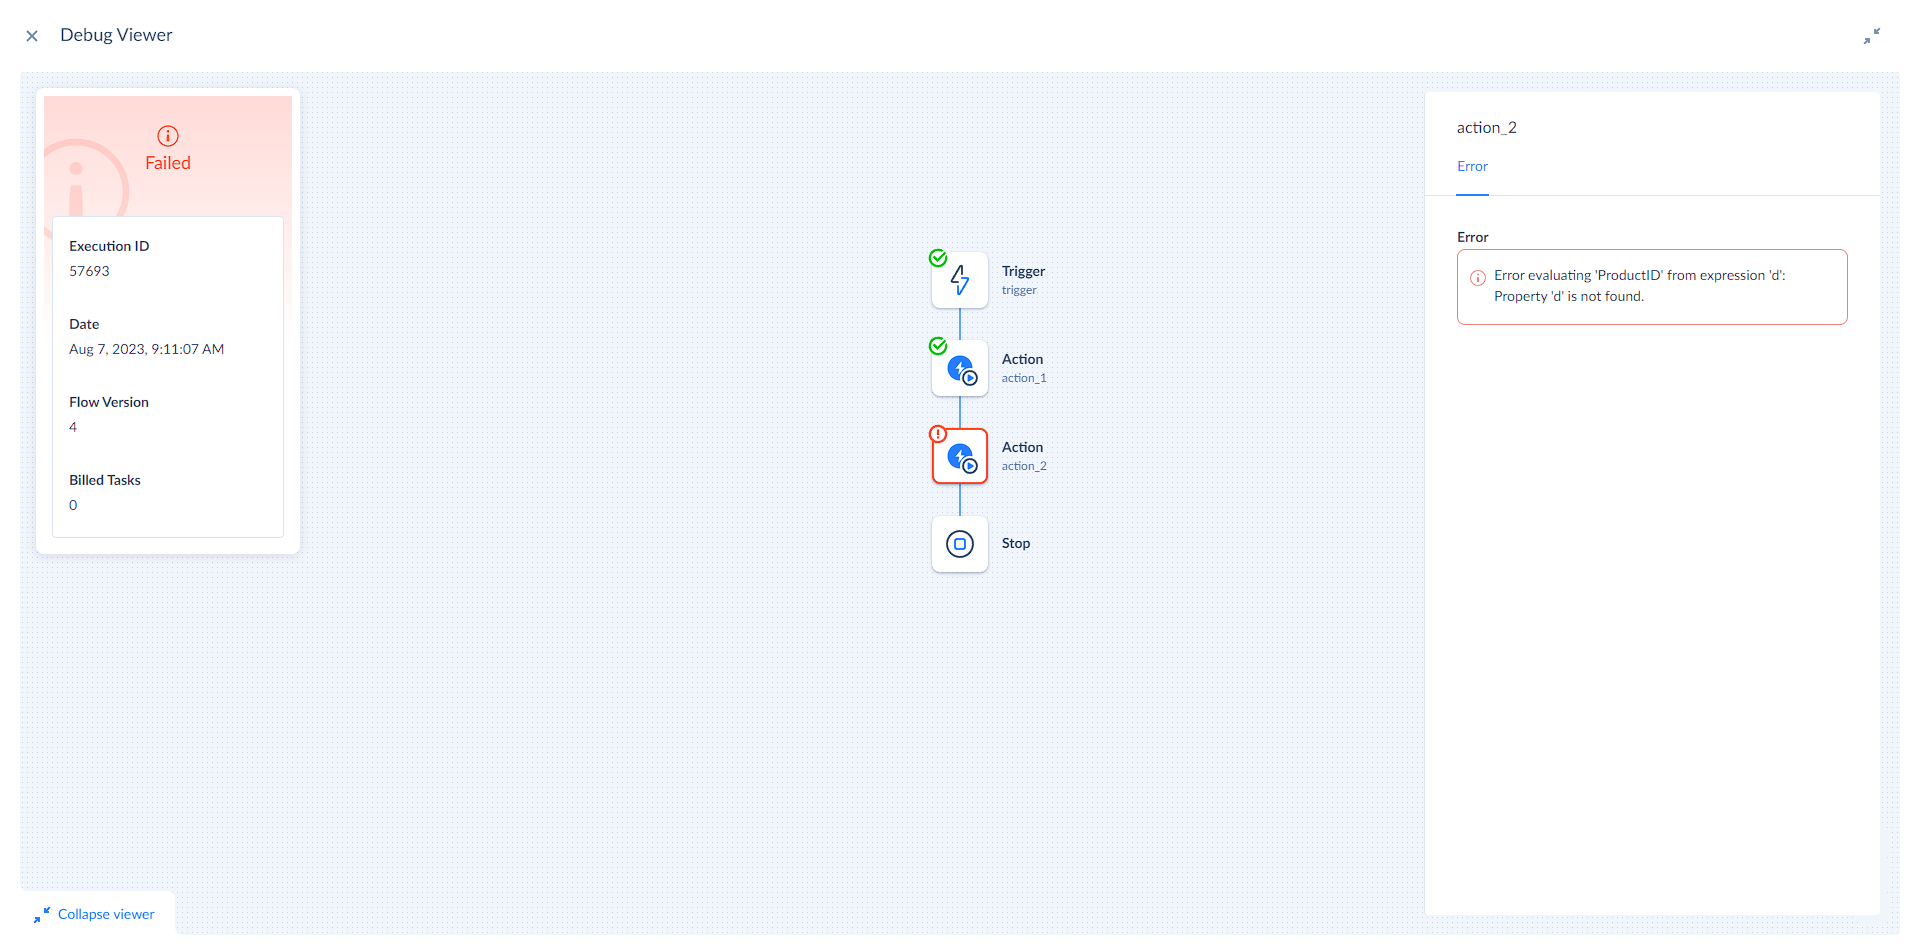
Errors
If there is an error in the component, you can check its details by selecting the component and going to the Error tab.
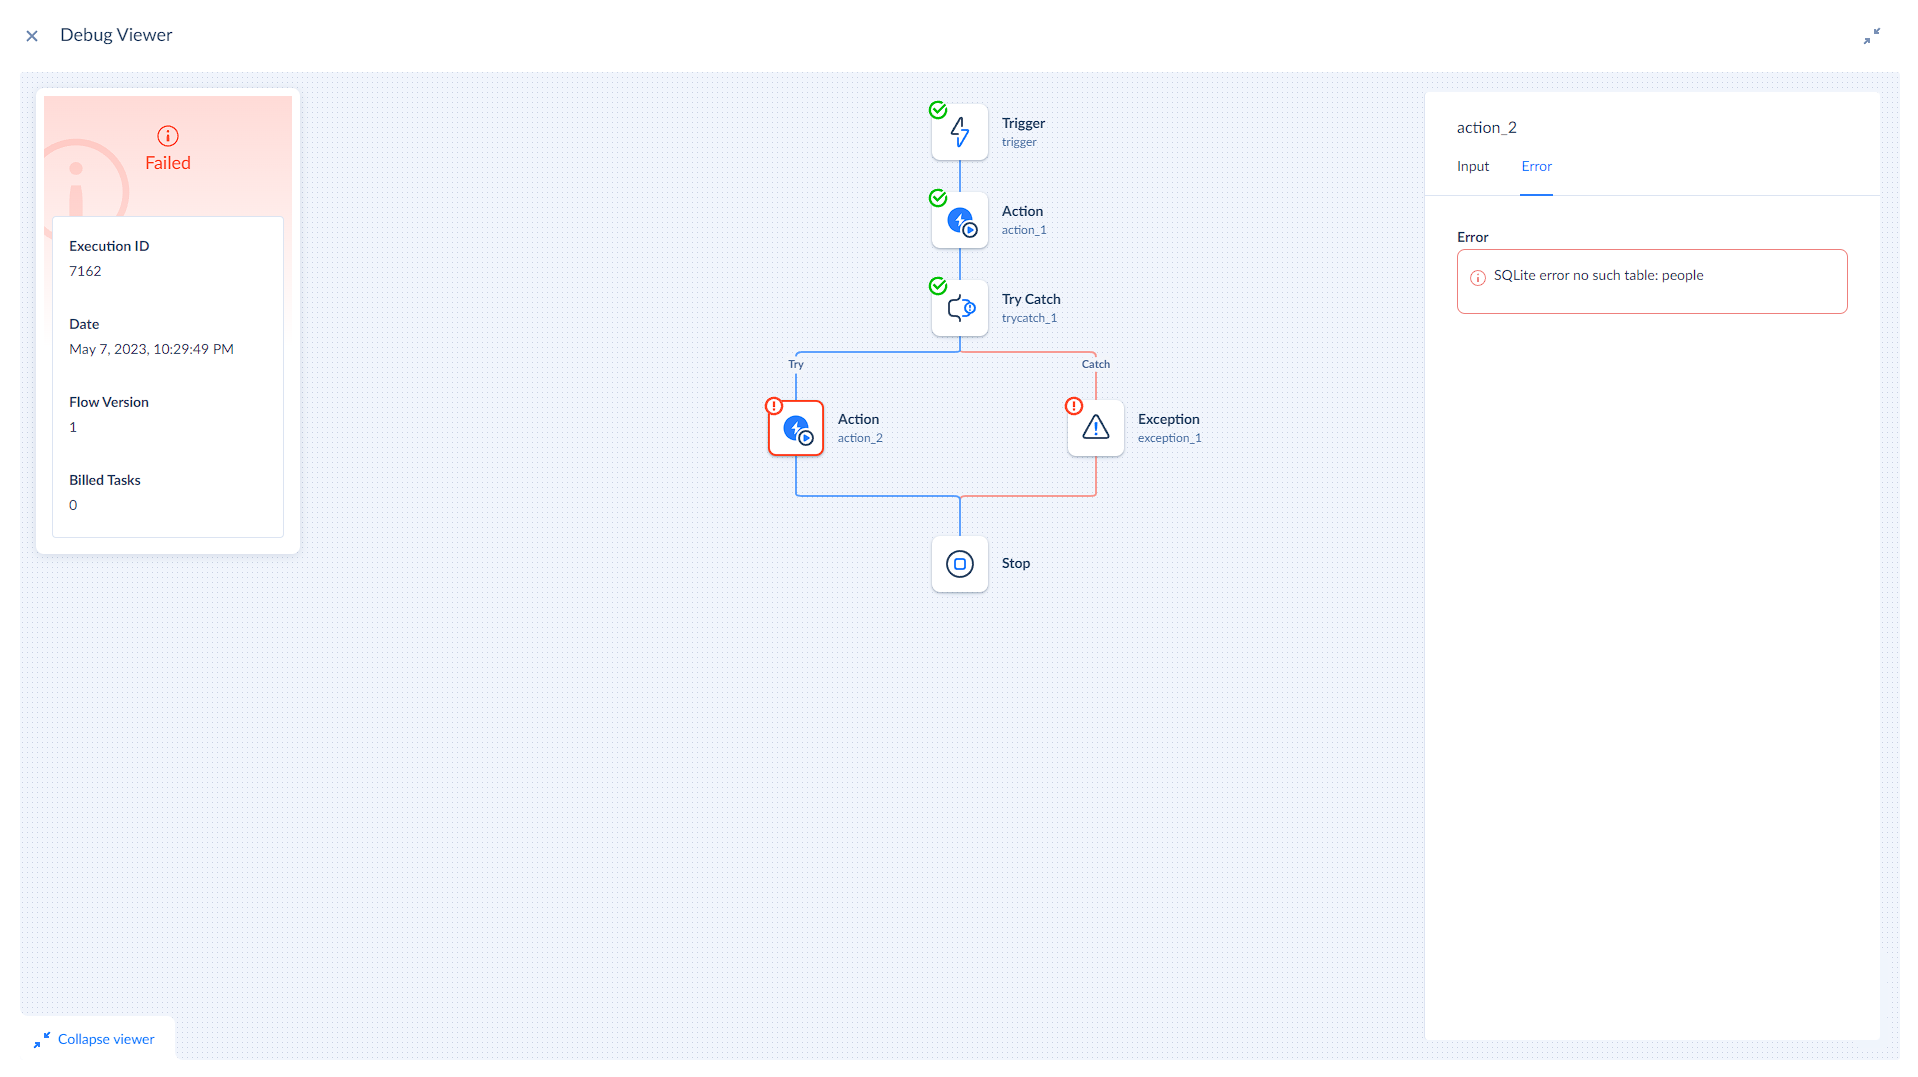
If the error appeared inside the Try/Catch component, and you have an Exception with an error message inside the Catch branch, this error message will be displayed in the execution details. To check the original error message, go to the Error tab of the component that caused the error.
Input and Output Data Values
You can check the Input and Output data values of the Trigger, Action, and Set Variable components.
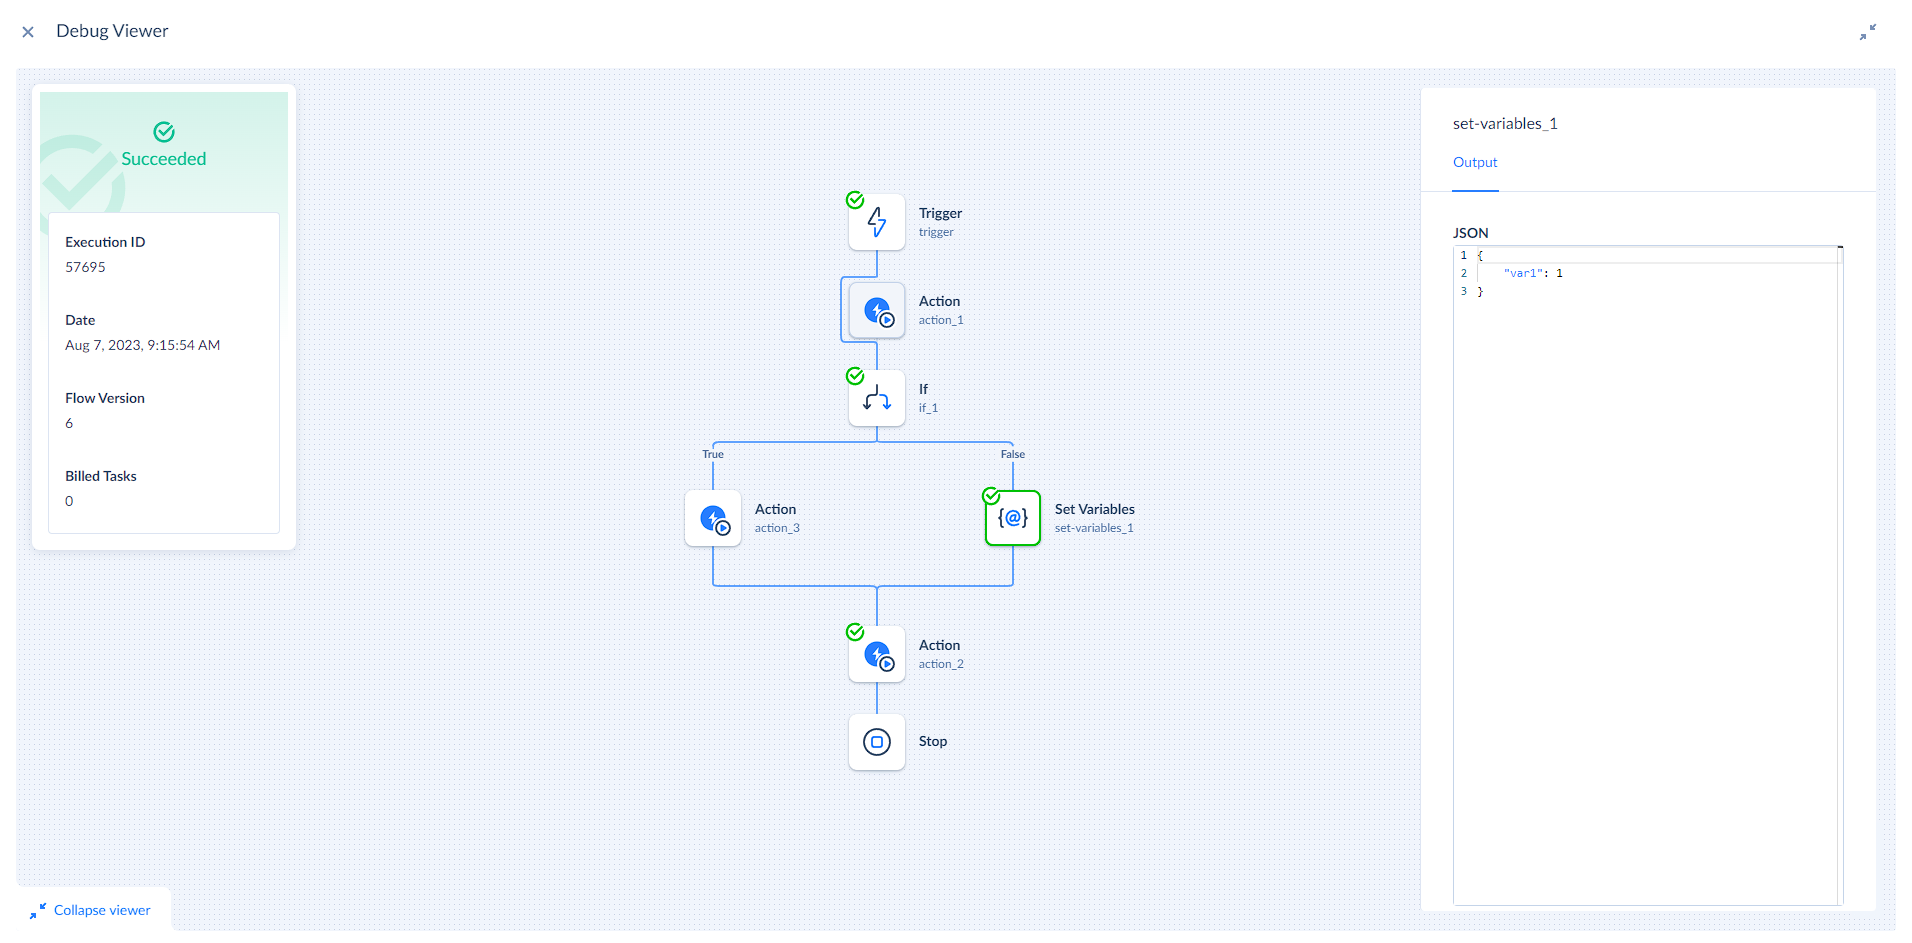
You cannot access the Input and Output of the disabled or skipped components as they do not interact with data.
Debugging Foreach Loop
When debugging a Foreach loop, the values you see in Input and Output of the Action component are values from the last iteration of the loop.
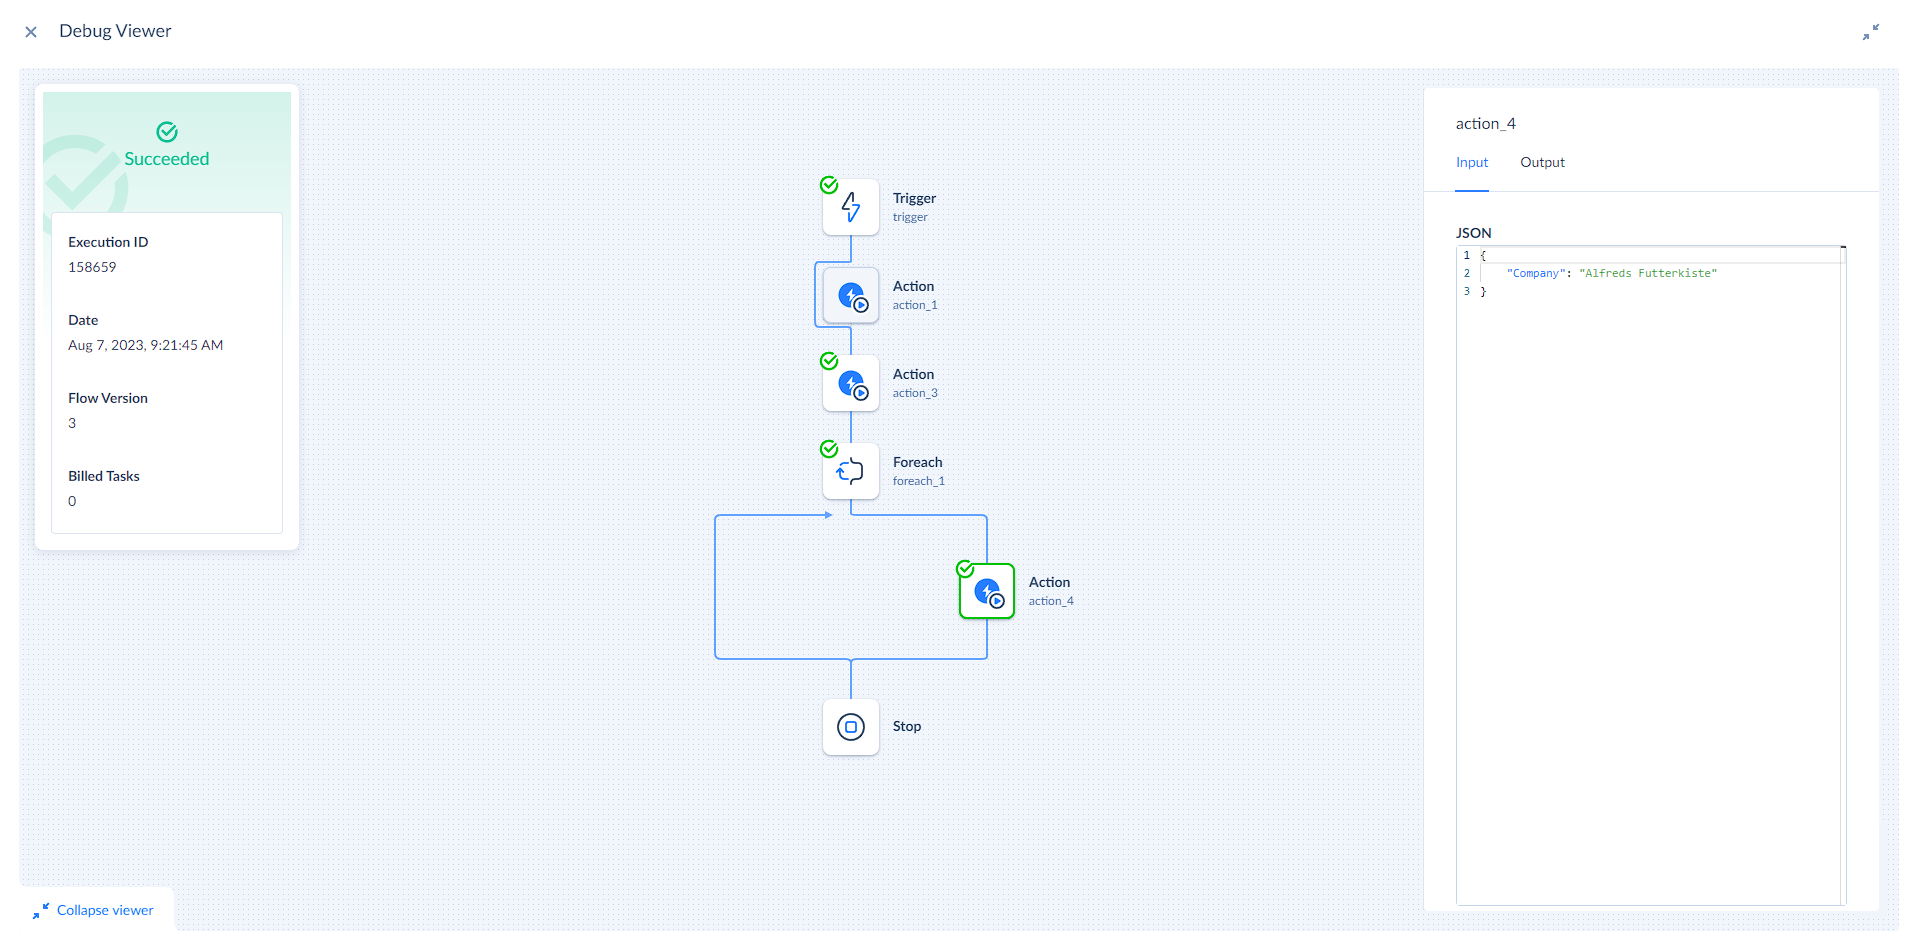
If you have multiple conditional branches within a Foreach loop, you will receive different values in Input and Output of the components that are located in different branches. Those are the values from the last iteration over the array where the condition for the branch was met.