How to Build or Edit Data Flow
Skyvia data flow allows you to integrate multiple data sources and enable advanced data transformations on the way to a final destination. There are several types of data flow components — source, target and transformation components. Each of these components can be considered as a separate block with its peculiarities and configurations that you need to arrange on the diagram.
In Skyvia, flows are built on the diagrams. It is a place where you add and arrange your components visually the way you want, connect components with links and configure the entire data flow scope. We've developed the diagram canvas to be far larger than your computer screen and added helpful features for you to be able to navigate easily around your canvas and move components as you like.
Working with the Data Flow Diagram
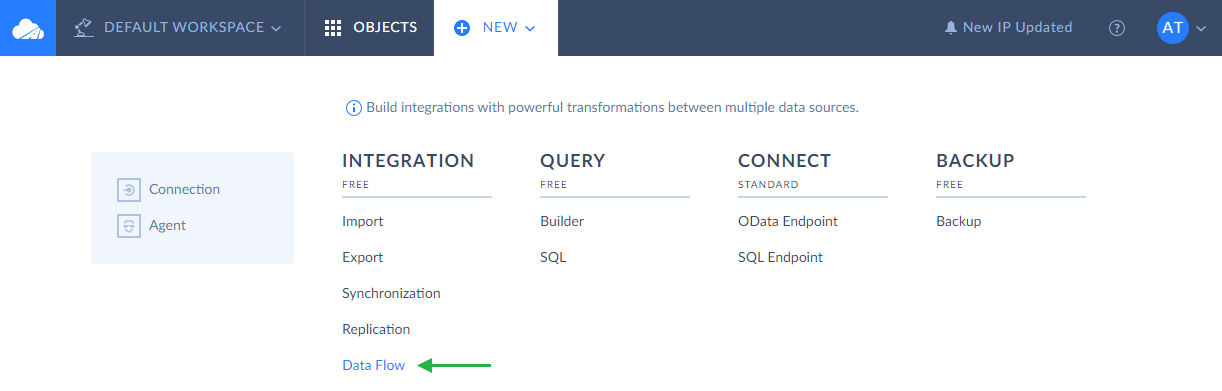
To build a data flow, click Create New in the top menu and select Data Flow in the Integration column.
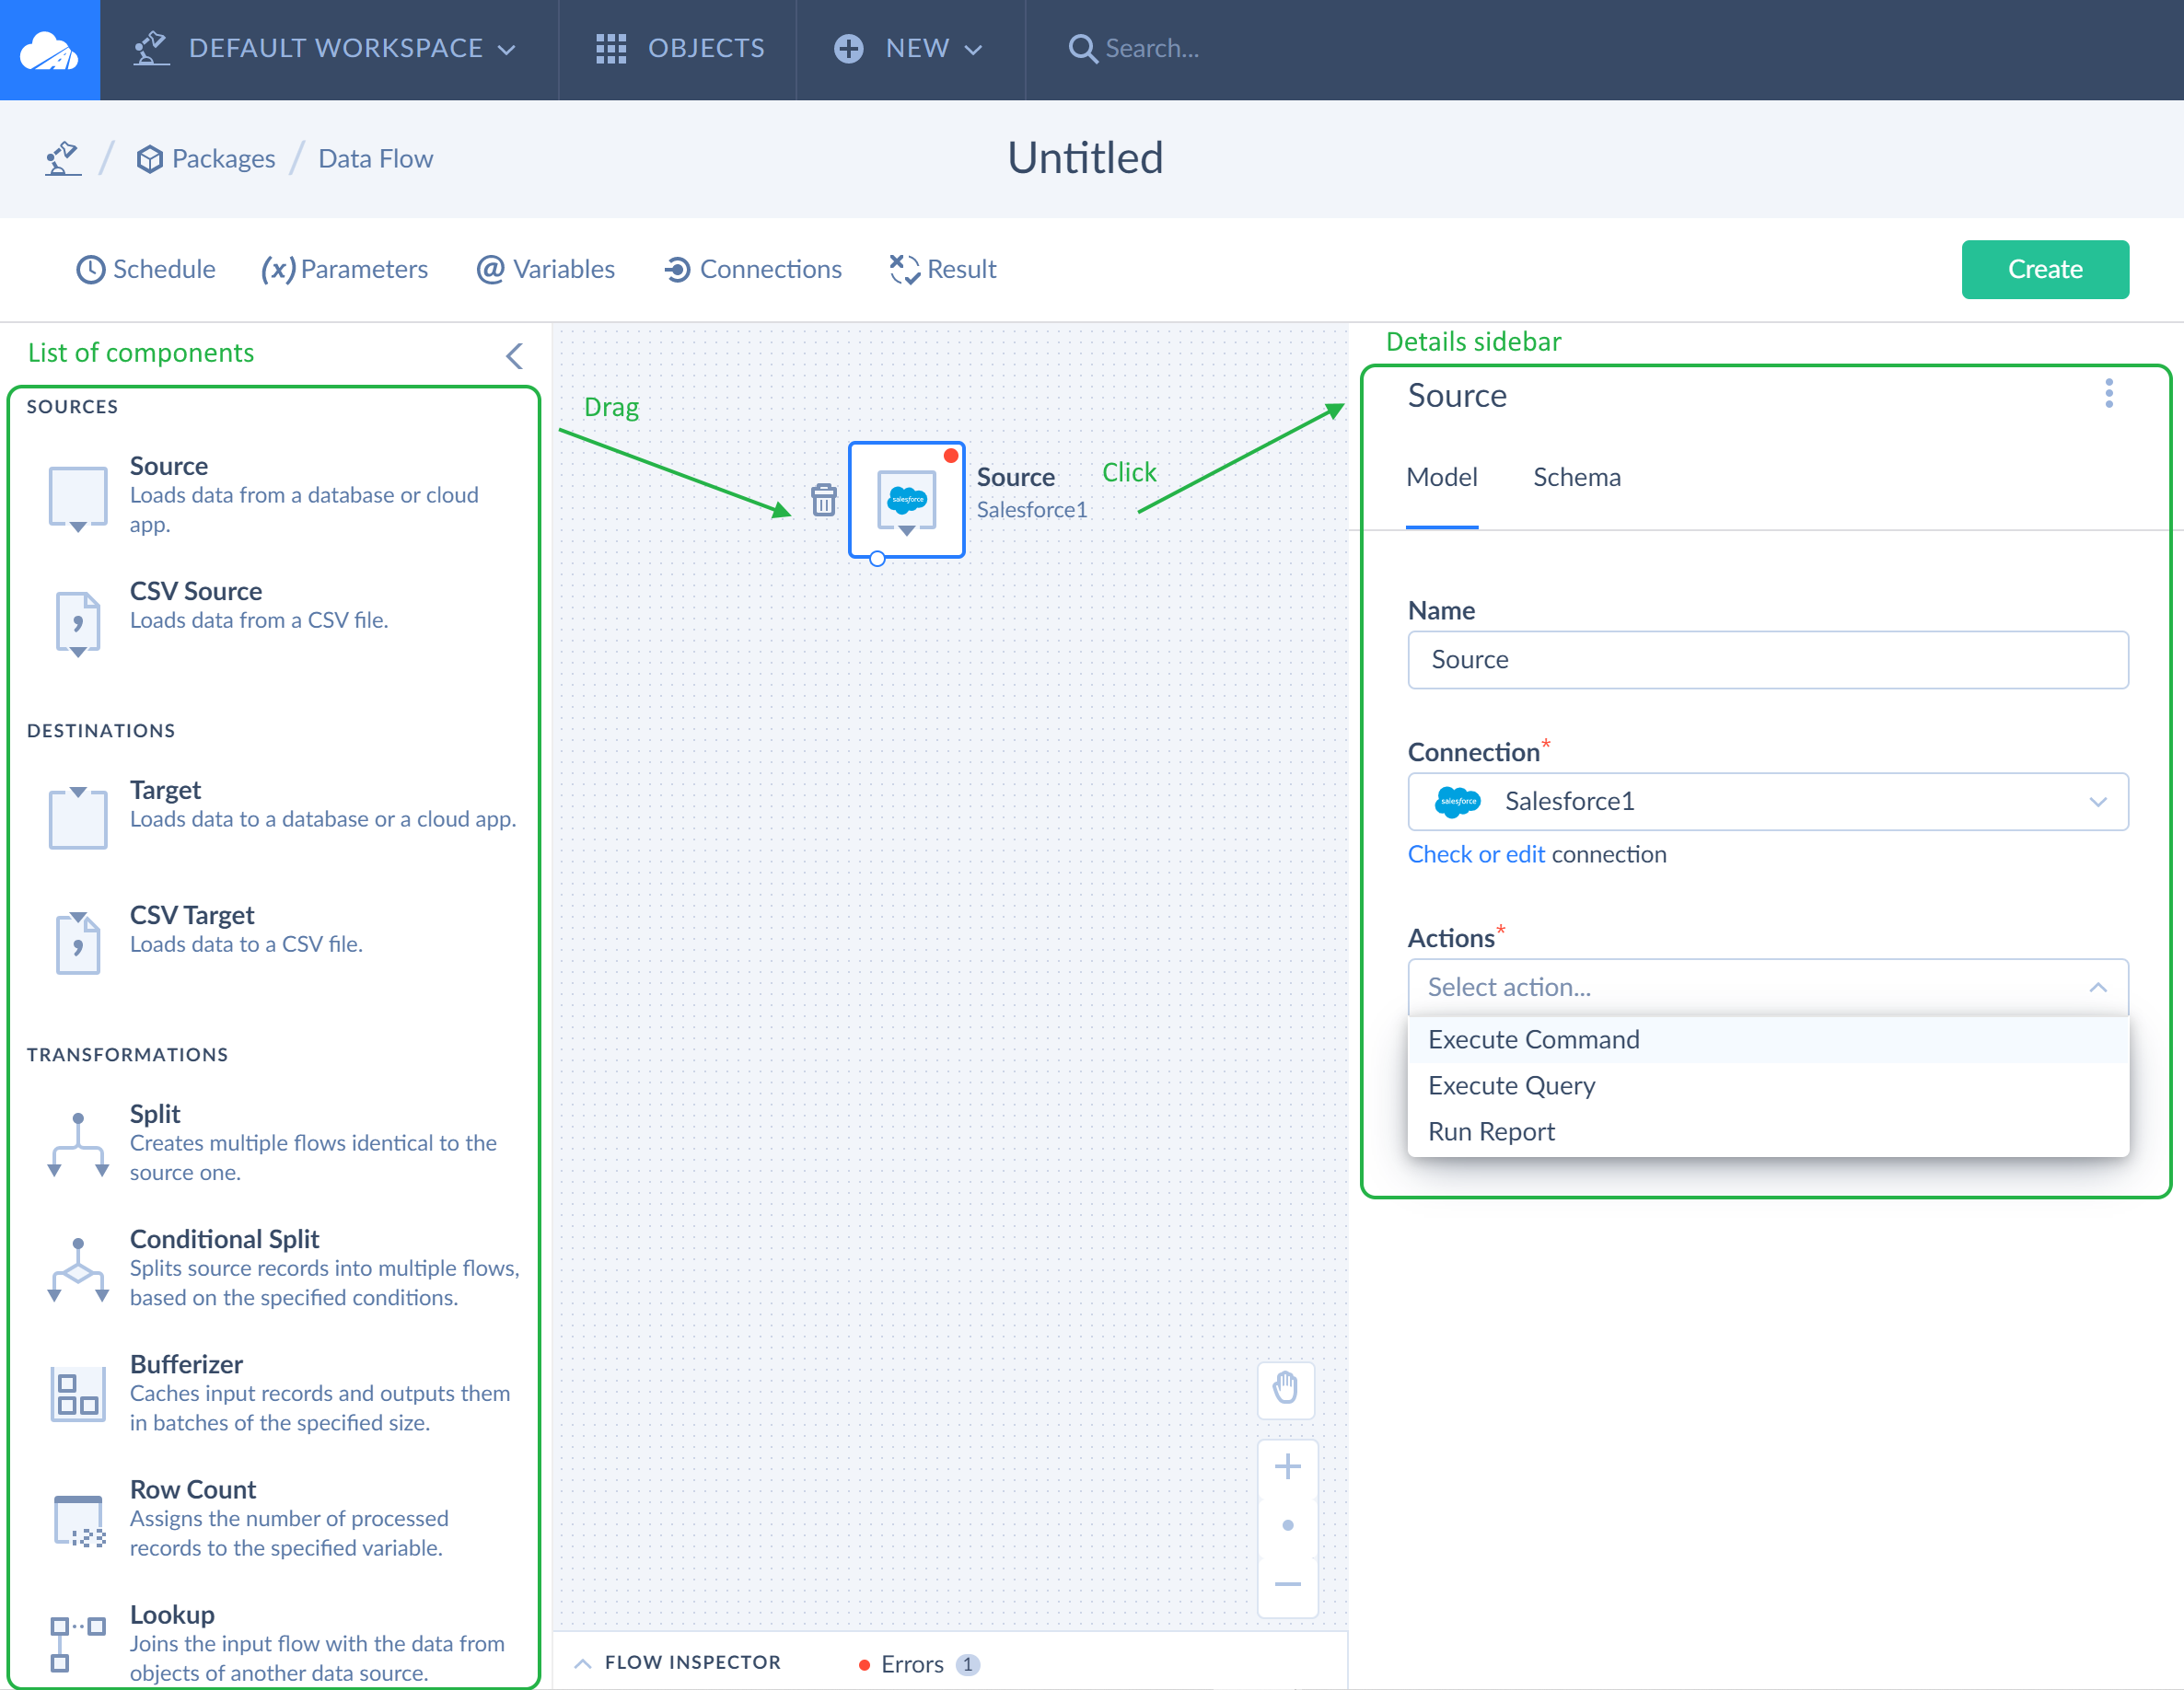
When the Data Flow editor opens, on the left side of the page you see a list of components, which you can use to build your flow. When building a flow, drag components one after another to the diagram and configure settings of each component separately in the details sidebar, which appears on the right as soon as you click on the component you want to configure setting of.
After you have finished configuring the first component, add the second component and connect configured components with a link, which is displayed on the diagram as an arrow and shows the direction of data movement between components.
That is a simple example of data flow structure without data transformations. Additionally, you can use advanced transformations (Extend, Lookup, Conditional Split, etc.) to make changes to your data, such transformations as deleting columns for example. You can read more about data transformation types in the Components topic. Please note you can easily edit, replace or delete one or several components out of the diagram in case of necessity.
Adding Components to the Diagram
Adding Source
Source is the very first component in the data flow. Each data flow starts with this component. It makes data from various external data sources available to other components within the flow.
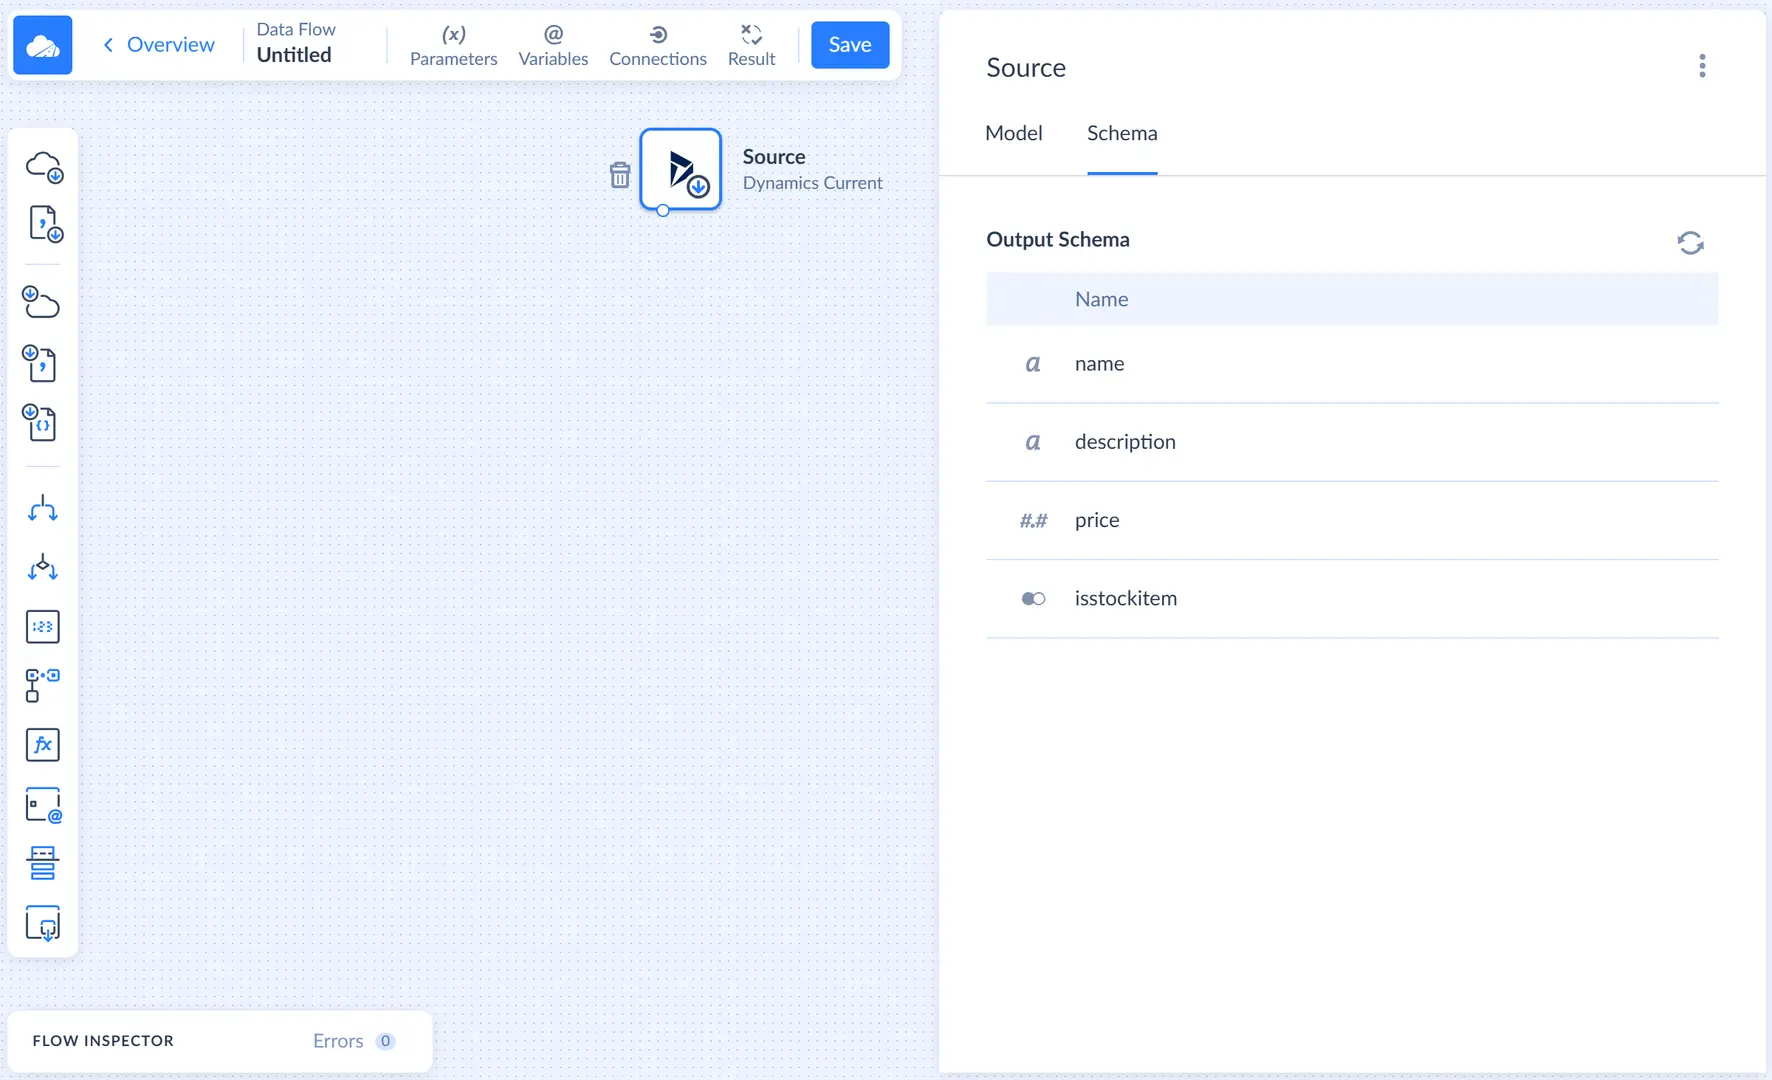
To work with Source, drag it from the components list to the diagram canvas, click on it and, after the Source details sidebar appears on the right, configure source settings.
First, you need to select a connection you want to use from the drop-down list. If you haven’t created the source connection yet, click +New connection and specify the connection parameters in the opened Connection page. Check the Connections or Connectors sections for more details.
Second, when the needed connection is selected, choose an action you want to perform in order to obtain data (Execute Command, Execute Query, etc.).
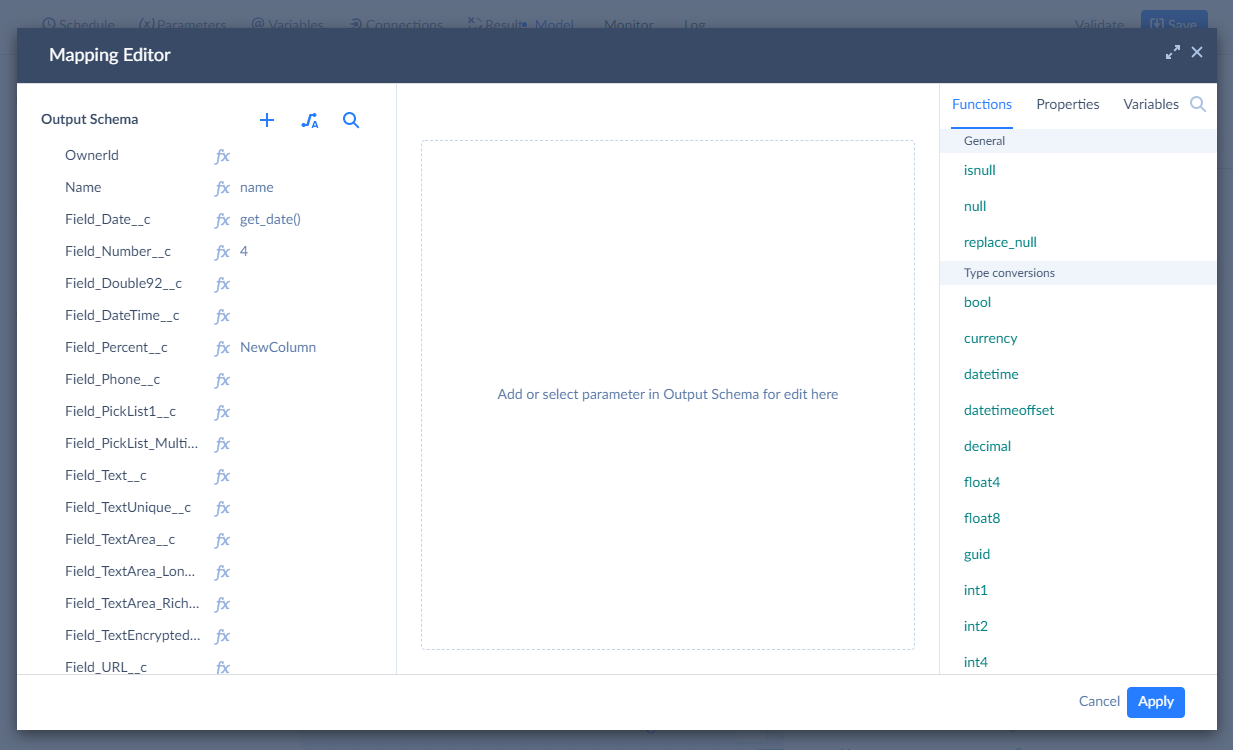
As a third step, optionally specify additional action parameters by clicking  next to Parameters and opening the Mapping Editor. You can read more about action parameters in the Actions topic.
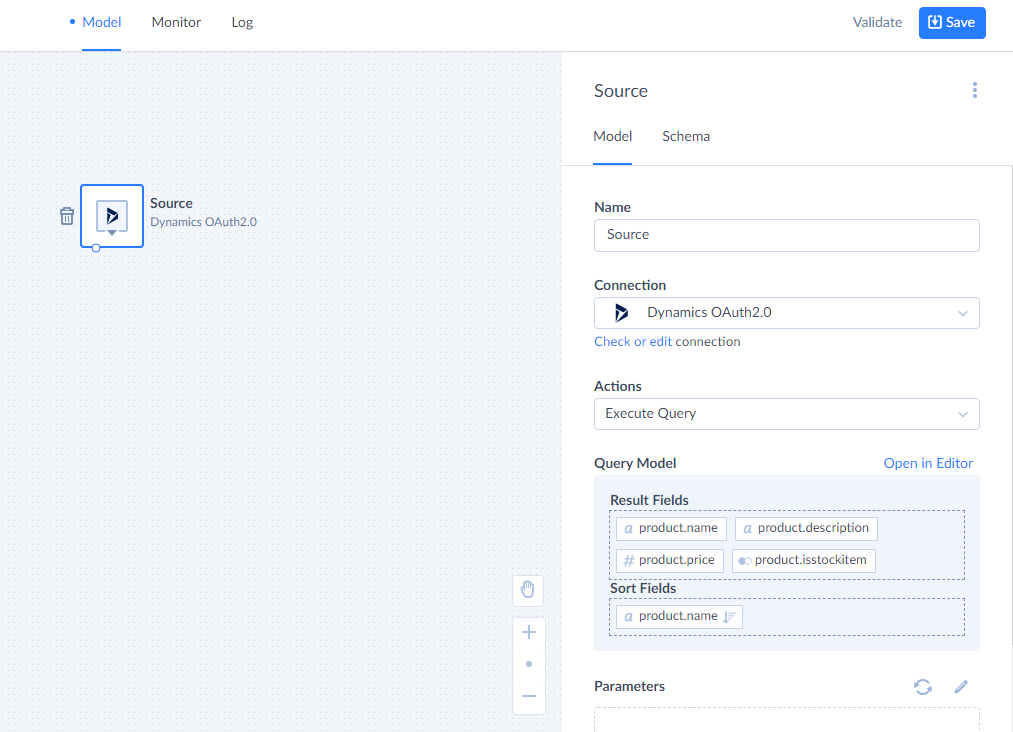
After you have configured a component, click the Schema tab on the right to see a schema with columns added to the data flow. Schema is displayed as a list of added columns and their types (string, decimal, Boolean, etc.).
Adding Transformations
Transformations are components, which help you modify data halfway between source and target. They include Lookup, Extend, Split, Conditional Split, Row Count, etc. You can use one, two or multiple transformations in one data flow, and how many of them to use depends strictly on your business needs.
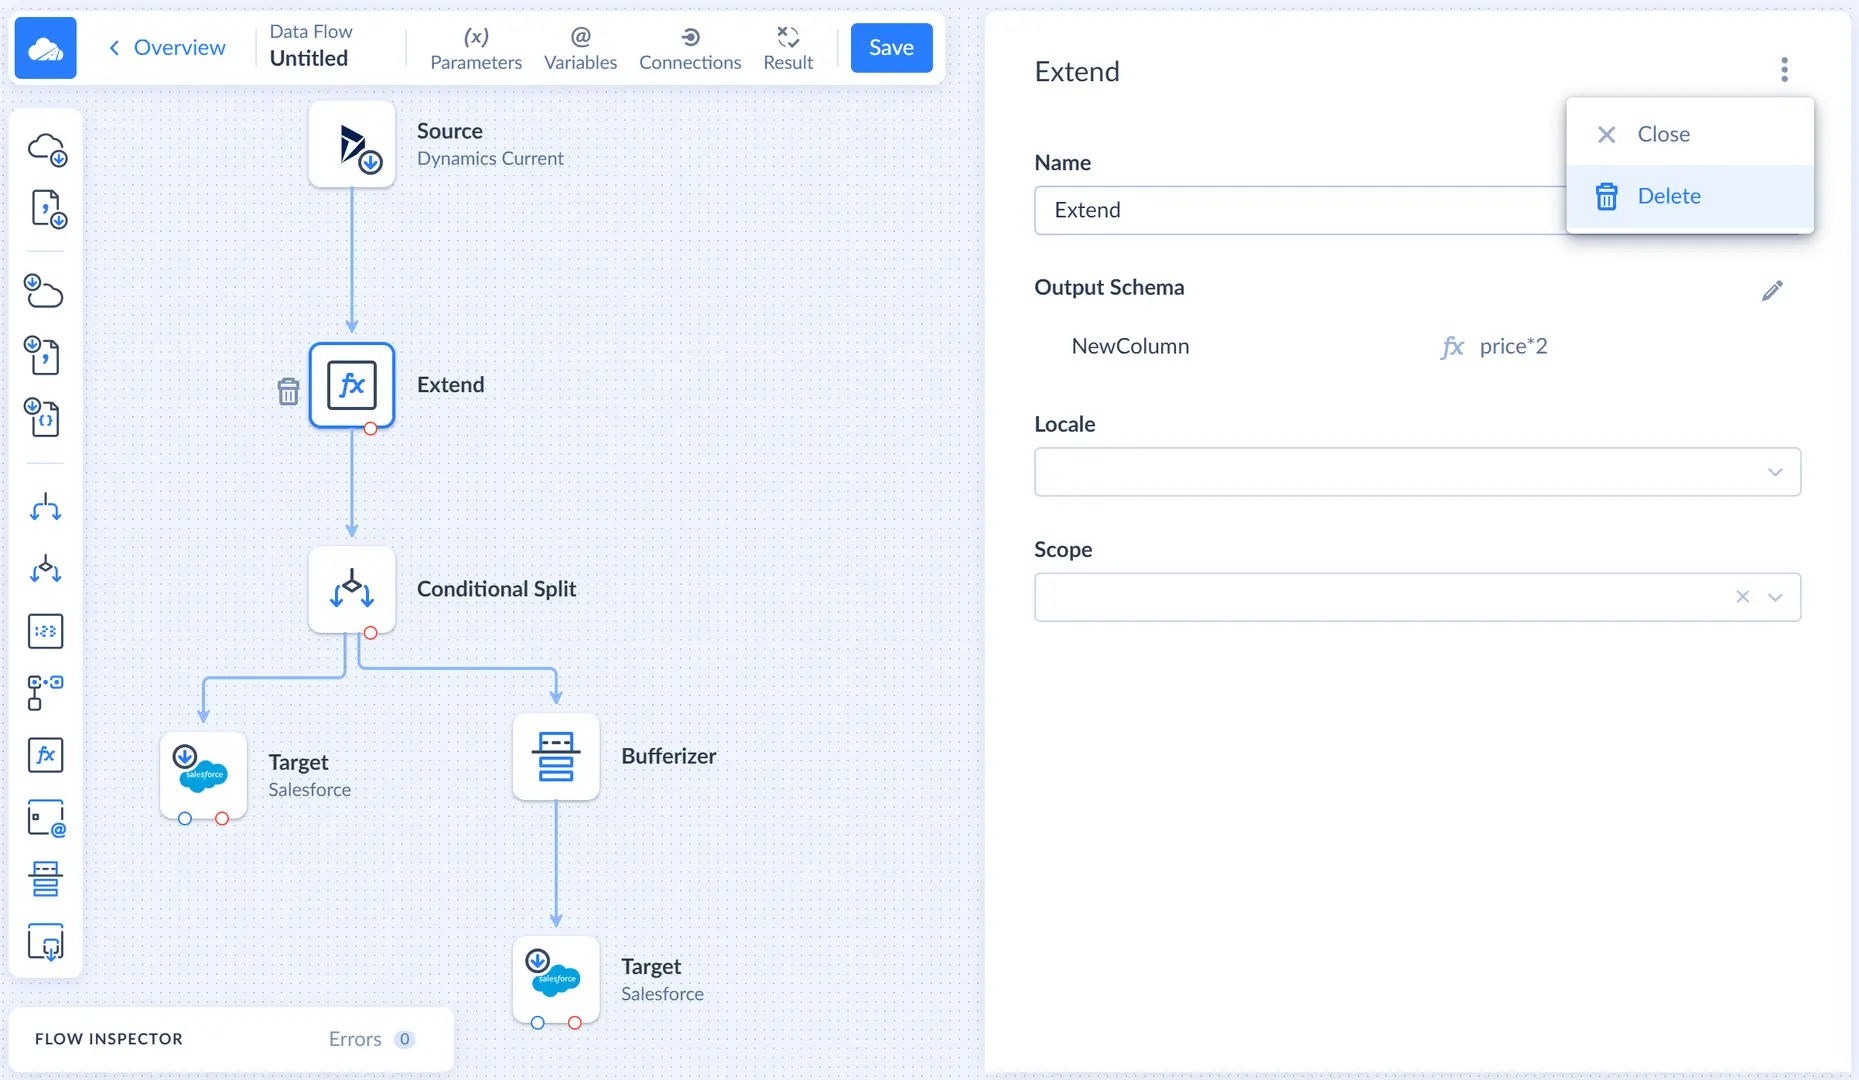
In our example, first, we add the Extend component. We have a task to find out what sum of money we will receive for each item of goods if we double the price. So, we take our original table, it contains fields — product.name and product.price. Using Extend, we add a new field, where we multiply our price by 2 — NewColumn price*2.
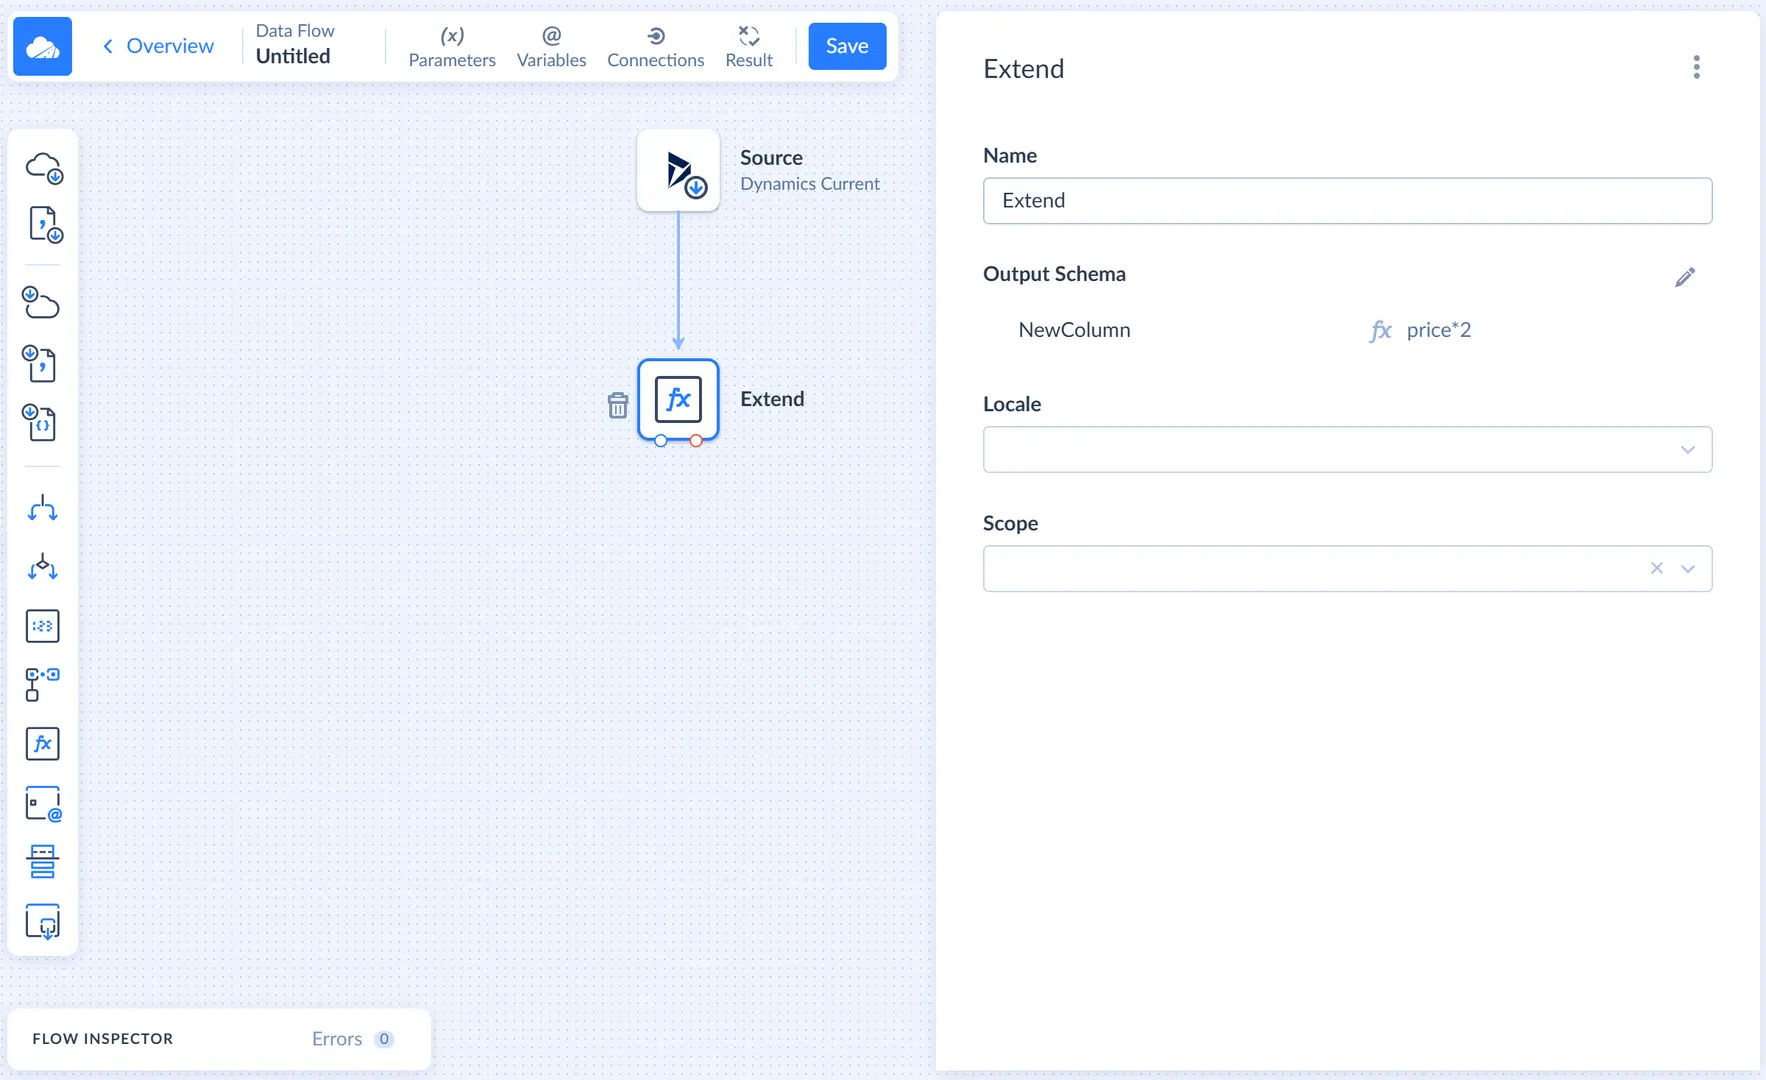
As a result, in the final table we receive three columns — product name, its original price and column with the doubled price.
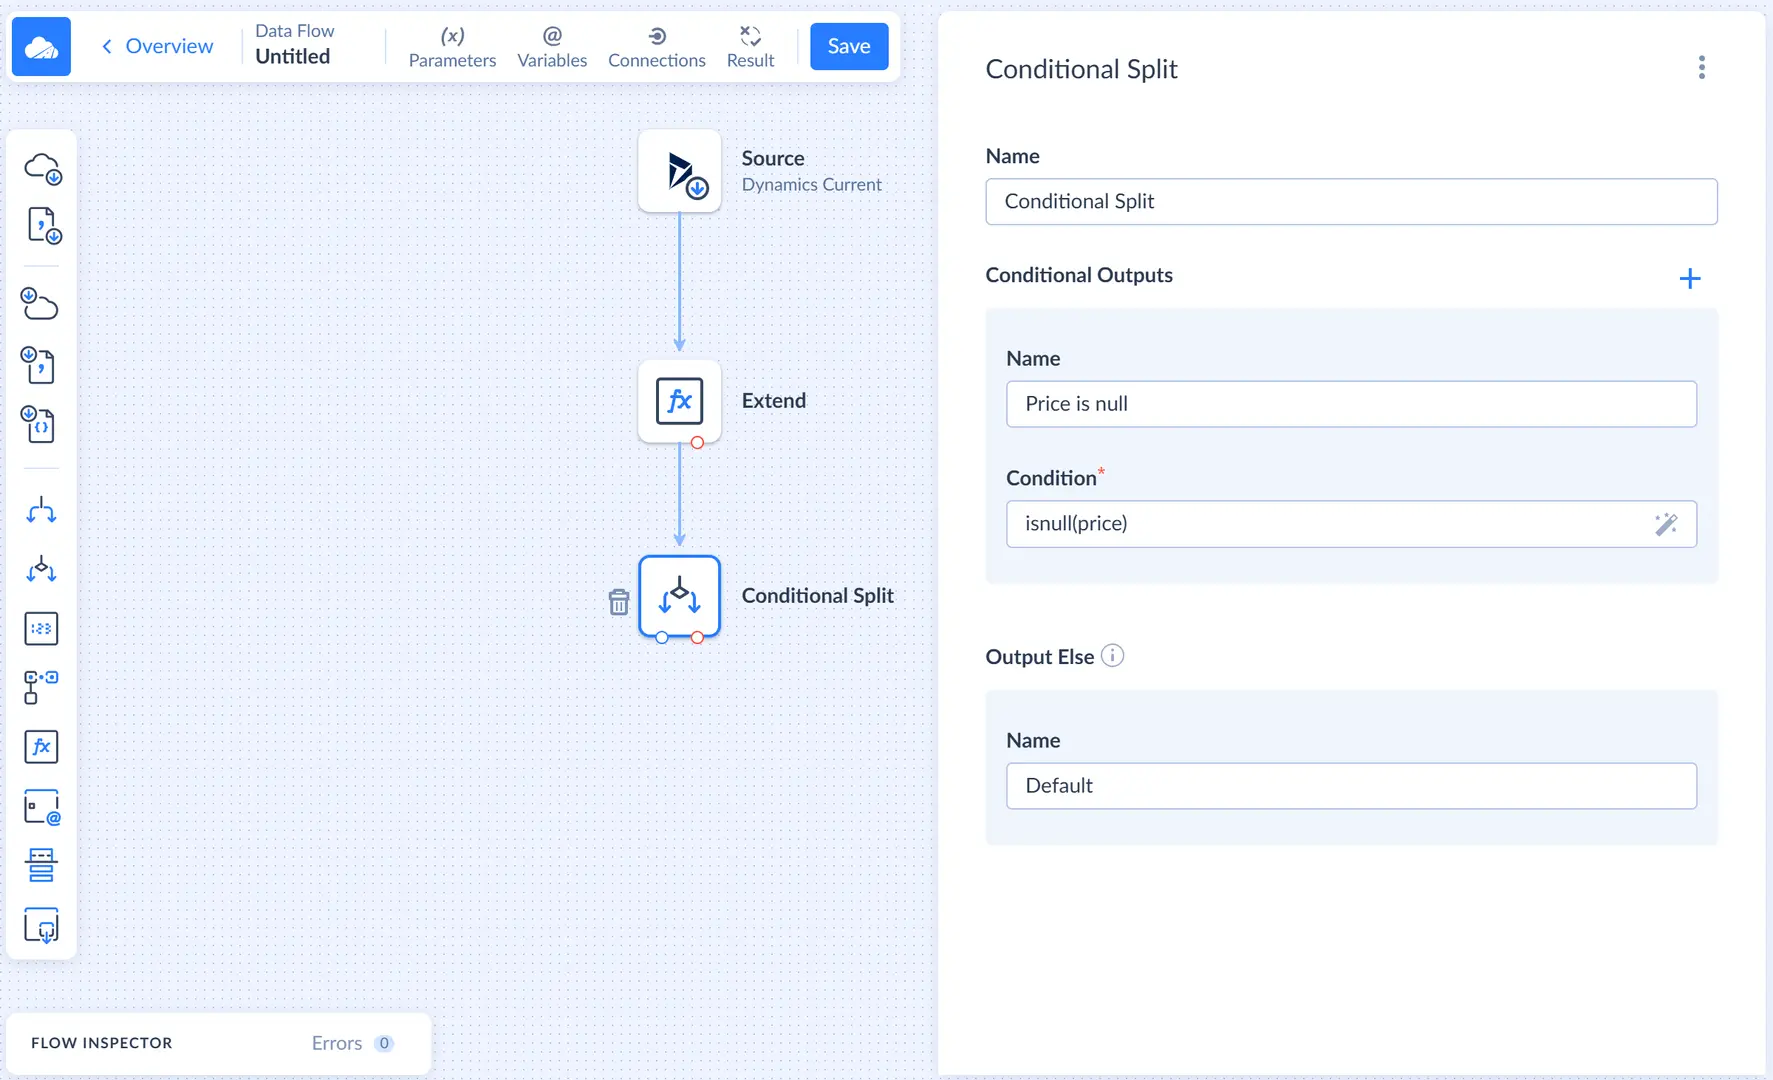
Afterward, as a second transformation step, we add the Conditional Split component. With its help, we split data received from the Extend component into two outputs — one output is default, another one is conditional output, where we set the condition price is null, i.e. all products with an empty price (those that are given away for free) will be passed to this output.
Components can be placed anywhere you want on your diagram. You simlpy drag them around and connect them to each other to pass data.
Adding Target
Target is a component of the data flow, which writes data from a data flow to a final destination (cloud app/database). Please note, a data flow can contain multiple targets to load data to.
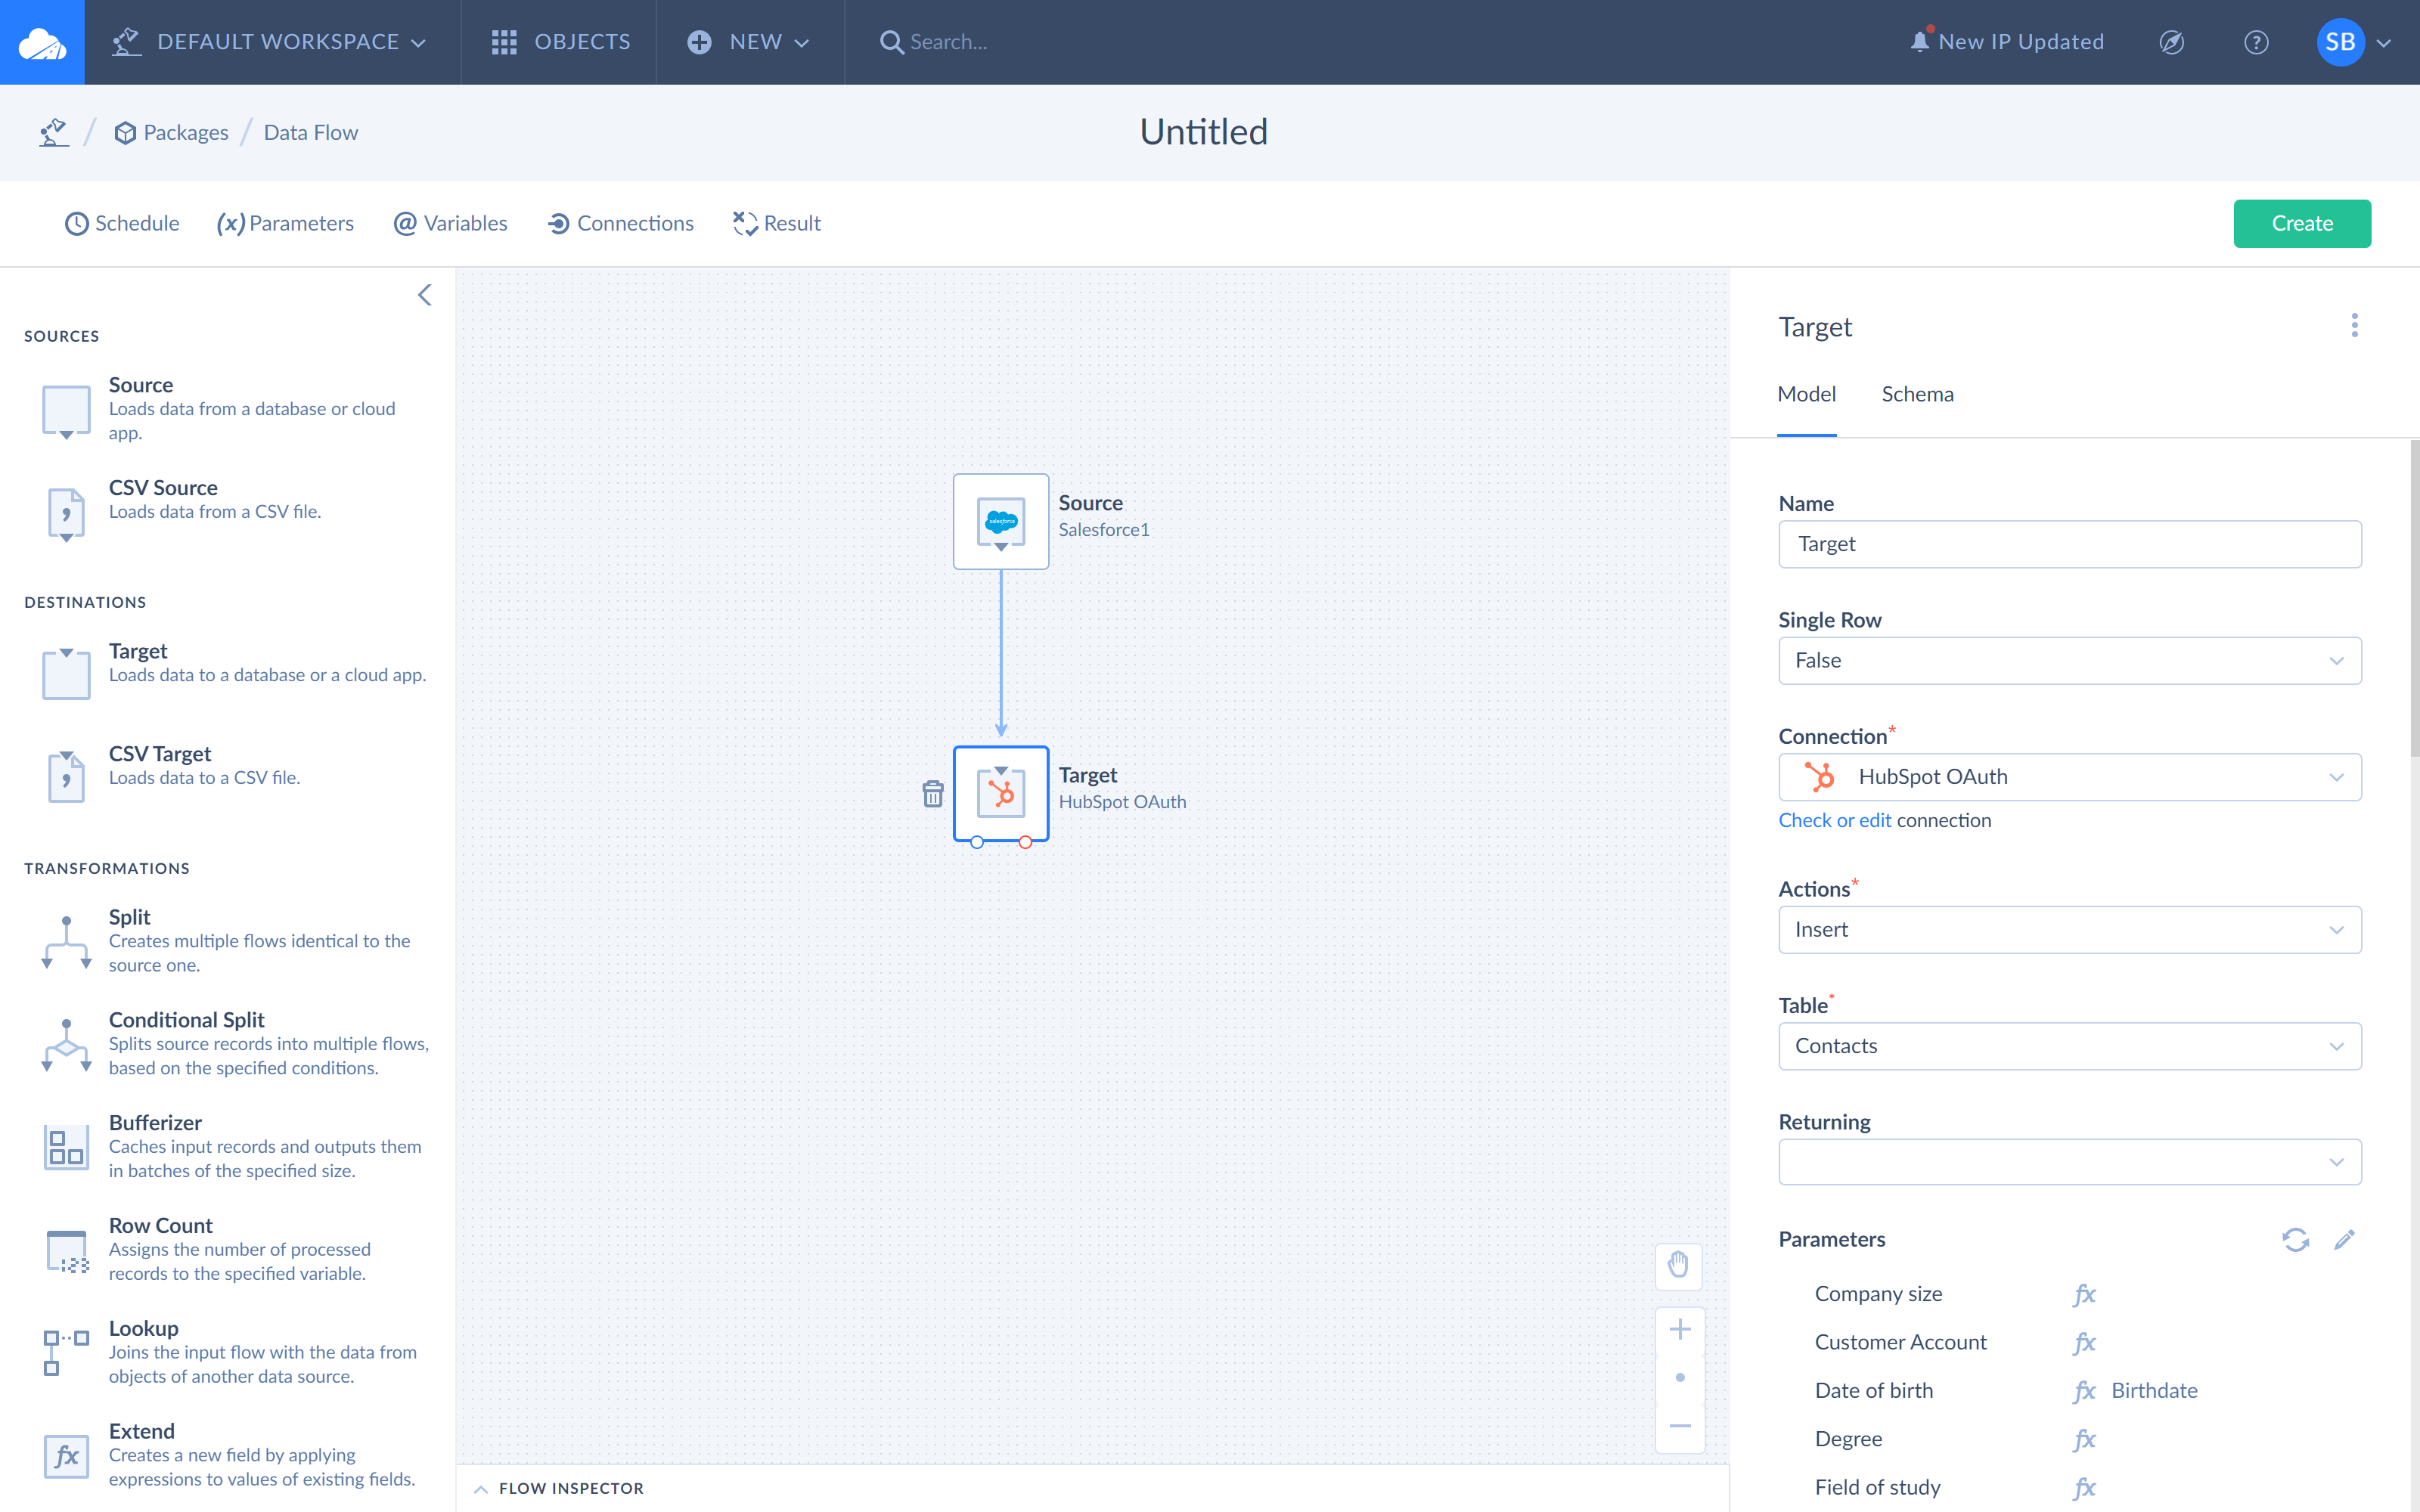
As in the case of source, to work with Target, drag it from the components list to the diagram canvas, click on it and, after the Target details sidebar appears on the right, configure target settings.
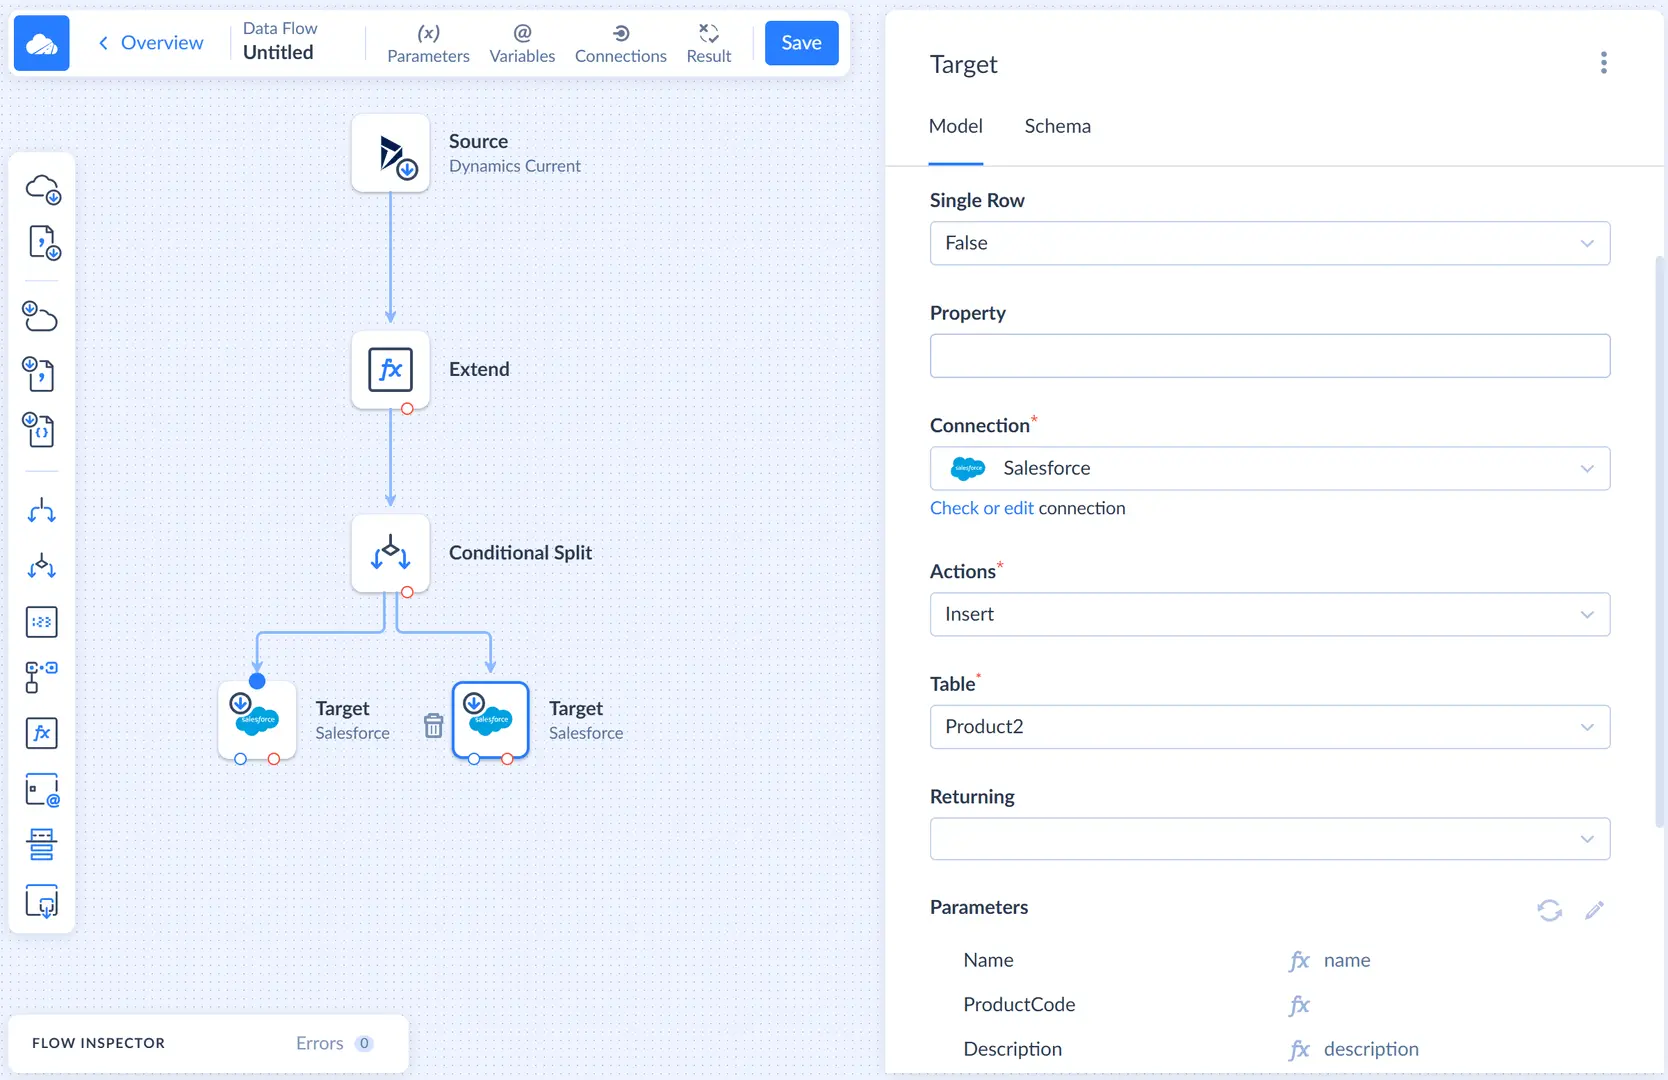
First what you need to know is that Target component may support batch data loading. If the connector selected by you as a target supports batch insertion, batch data loading is used by default in Skyvia. However, if you don't want to load data in batches for a certain target component, you can set its Single Row parameter to True. In this case, the single row returns a single result row for every row of a queried table in a database or cloud app.
Second, select a connector you want to load data to. If you haven’t created the target connection yet, click +New connection and specify the connection parameters in the opened Connection page. Read more about it in the Connections or Connectors sections.
Third, select an action you want to be executed. Depending on the target you want to write data to, you can perform different types of actions, among which — Insert, Upsert, Update, Delete, Execute Command. The types of actions depend strictly on the cloud app or database you have selected as a target. After you have selected an action (for example Insert), in the Table drop-down list, you need to choose which table you want to insert data to.
Optionally, you may also specify Returning feature, which is available for an Insert action only. This feature allows returning the ids (or any other fields) of the records inserted to target back to a field (or fields) of the corresponding source record. And finally, you may optionally specify additional action parameters by clicking next to Parameters and opening the Mapping Editor.
Connecting Components with Links
Links allow to connect components, they are displayed as arrows on the diagram and tell (show) Skyvia how to pass the data across components.
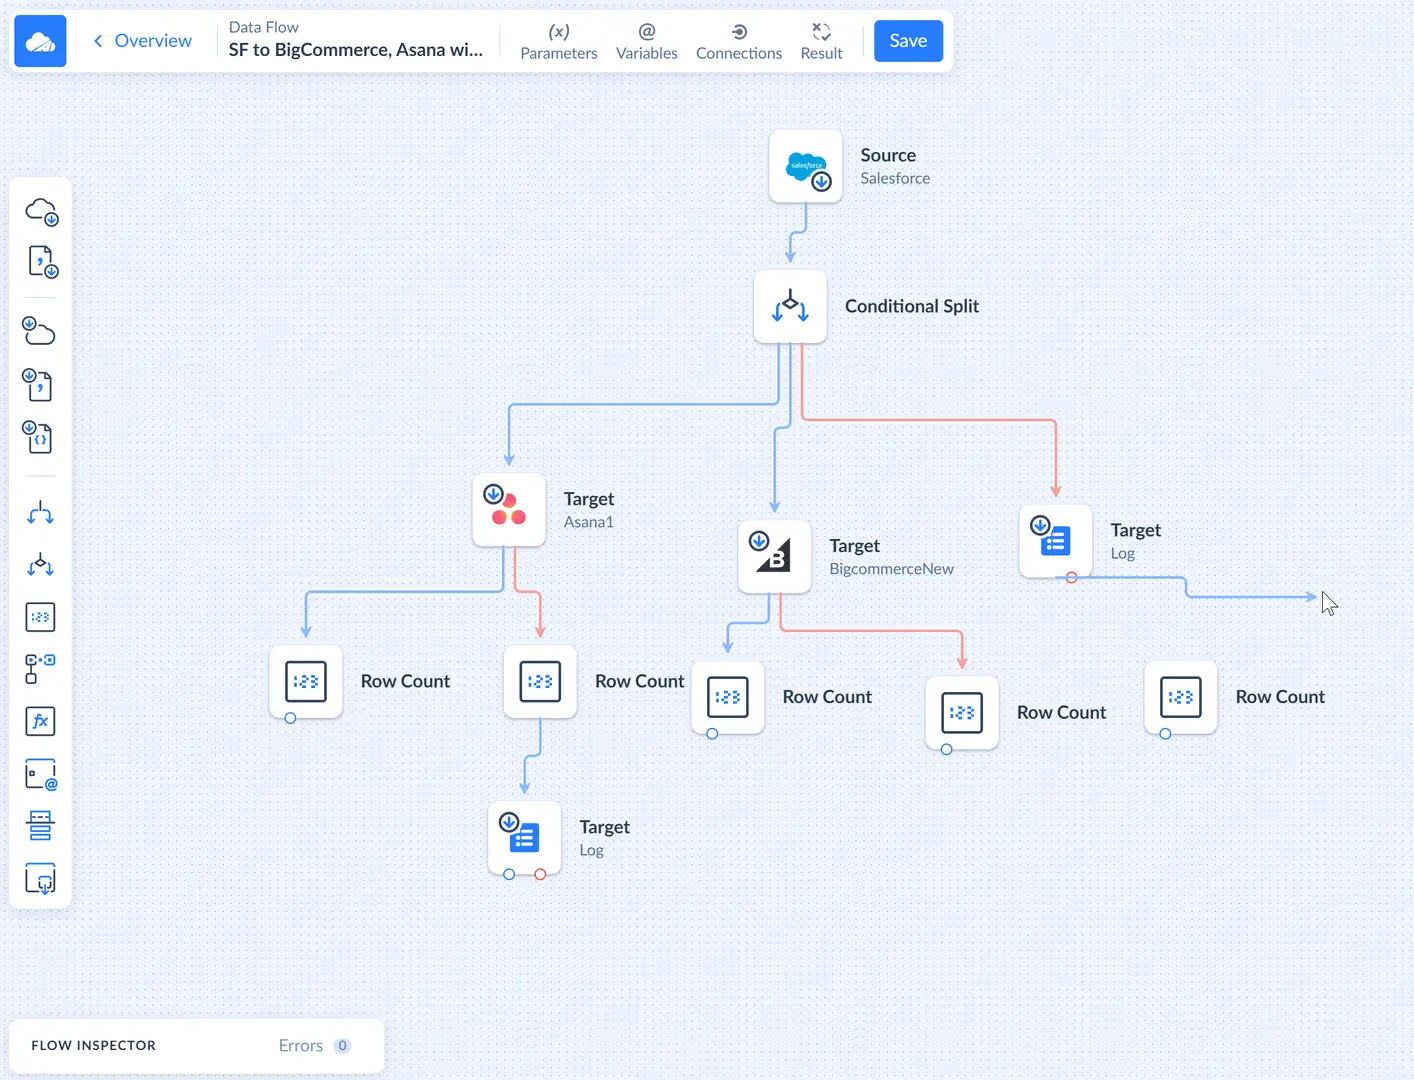
To connect components, hover over a small circle on the component and when the circle gets bigger, drag a link (arrow) from one to another component, connecting them.
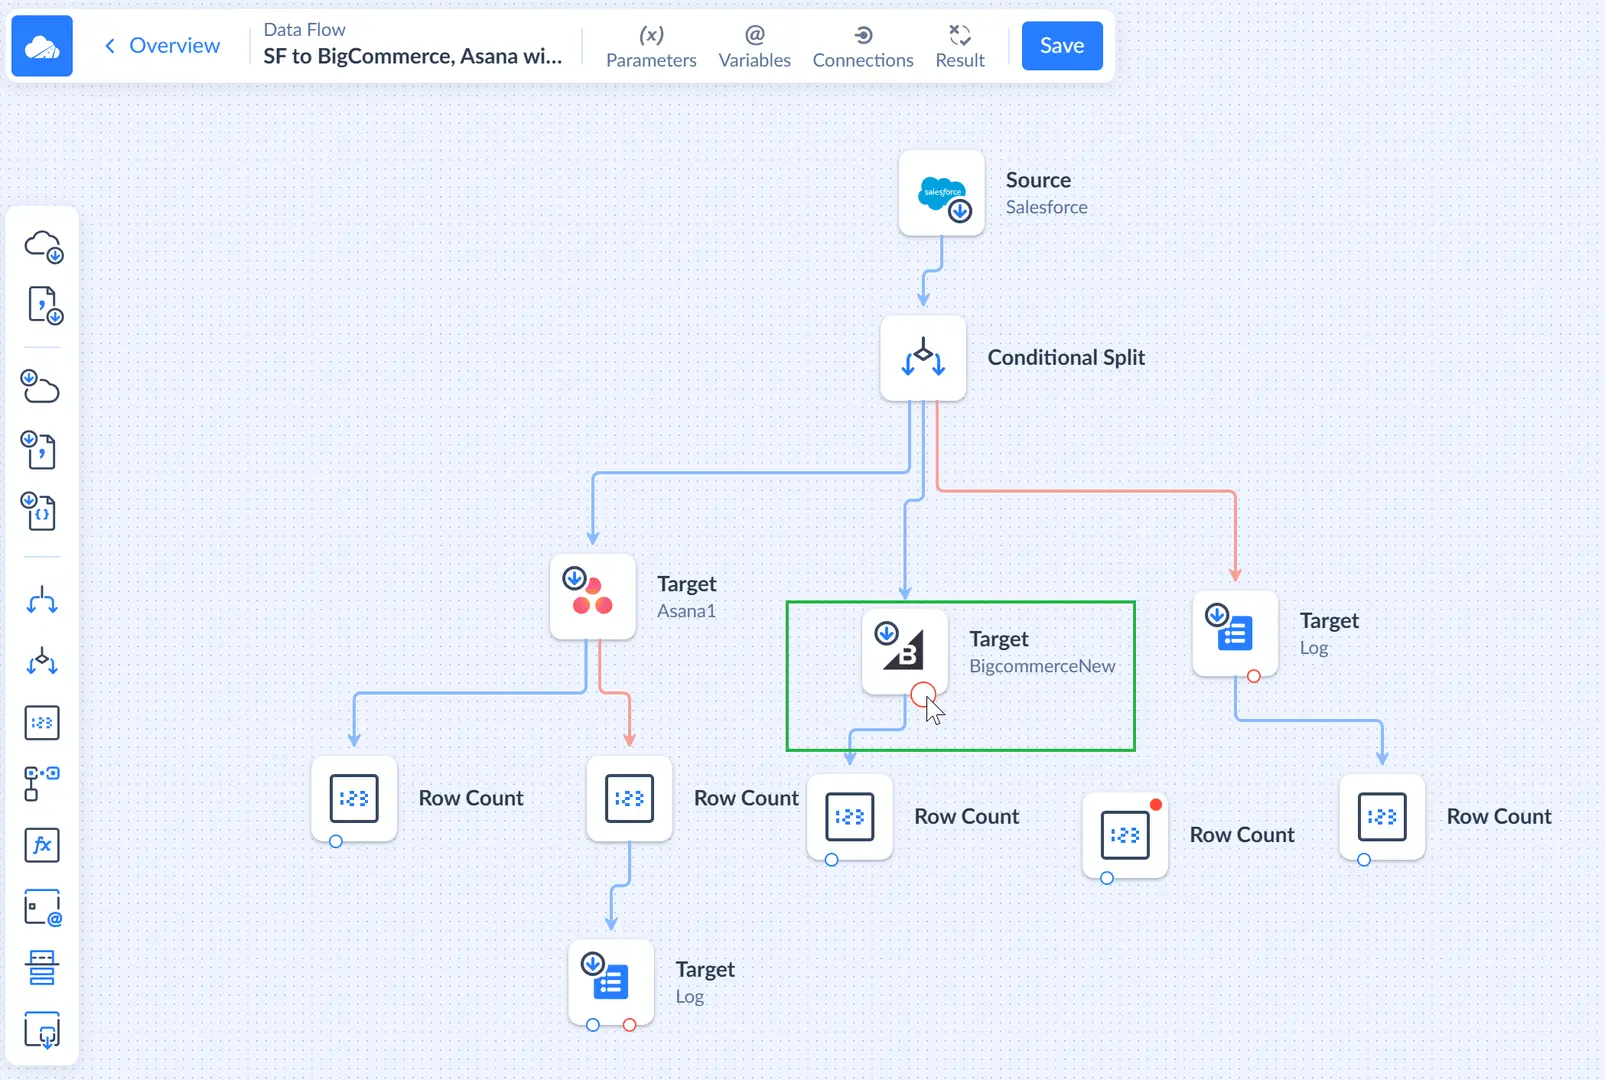
You can also disconnect components by pulling the arrow from the receiving component aside, i.e. pulling it to an empty space of the diagram. Once components are connected, they will remain connected as you move the components around on the diagram.
Please note the blue circle is for regular outputs, and red circle is for an error output. If the component has multiple regular outputs, you will be asked for the name of the output to select.
When you click a certain link on the diagram, details sidebar appears on the right. Here you can view link details and its scope — all the record columns, going through this link, their data types and components they originate from.
Copying and Pasting Components
If you need to add multiple components with similar settings, you can configure one of them, and then copy it and paste copies on the diagram using CTRL+C and CTRL+V keys. The copy will be configured in exactly the same way as the original, but it will not be connected to other components, and thus, it will probably be invalid. You need to connect it to other components, and maybe make some changes to component configuration.
You can even select and copy multiple components. In this case, all the connections between the original components will be copied too.
Deleting Components and Links
To delete any component from the diagram, simply click on it. As soon as you do it, you will see the  icon next to the component. Click the icon to delete the component with all its settings. To select another component for deletion, perform the same steps.
Another way to delete a component is to click the ![]() More Options icon in the component details sidebar and select Delete from the drop-down list.
More Options icon in the component details sidebar and select Delete from the drop-down list.
To delete a link between components, click it and pull it aside from the receiving component (to any empty space on the diagram) or click the ![]() More Options icon in the details sidebar of the link and select Delete from the drop-down list.
More Options icon in the details sidebar of the link and select Delete from the drop-down list.
Navigating around the Diagram Canvas
As mentioned earlier the diagram canvas is designed to be far larger than your computer screen, so we've added helpful features for you to be able to navigate easily around your canvas and move the diagram or components as you like.
Panning
For some large data flows, you will need to move the diagram up and down or sideways to see all of its components. For this, you can use either the pan mode or scrolling. To use the pan mode, click the  Pan mode icon in the lower right corner of the canvas to enable the mode and then click anywhere on the canvas and, holding it, move your mouse to move the canvas. The pan occurs in real time, which means you see how the work area moves as you drag it across the screen. The other way to pan is to scroll. For this, use the scroll wheel of a mouse. Spinning a scroll wheel will move the diagram up and down on the canvas. Holding the shift key and spinning the wheel will shift the canvas horizontally left and right.
Zooming
You can zoom in and out of the diagram canvas to adjust your view. Click the  Zoom In icon to increase the zoom level or click the
  Zoom Out icon to decrease the zoom level. That's zooming. It is good to note that the zoom uses the middle of the canvas as its point of reference so combining panning and zooming is a great way to effectively move around the canvas.
![]()
Please note that you can easily return the original diagram size and its location on the canvas by clicking the ![]() Default icon.
Default icon.
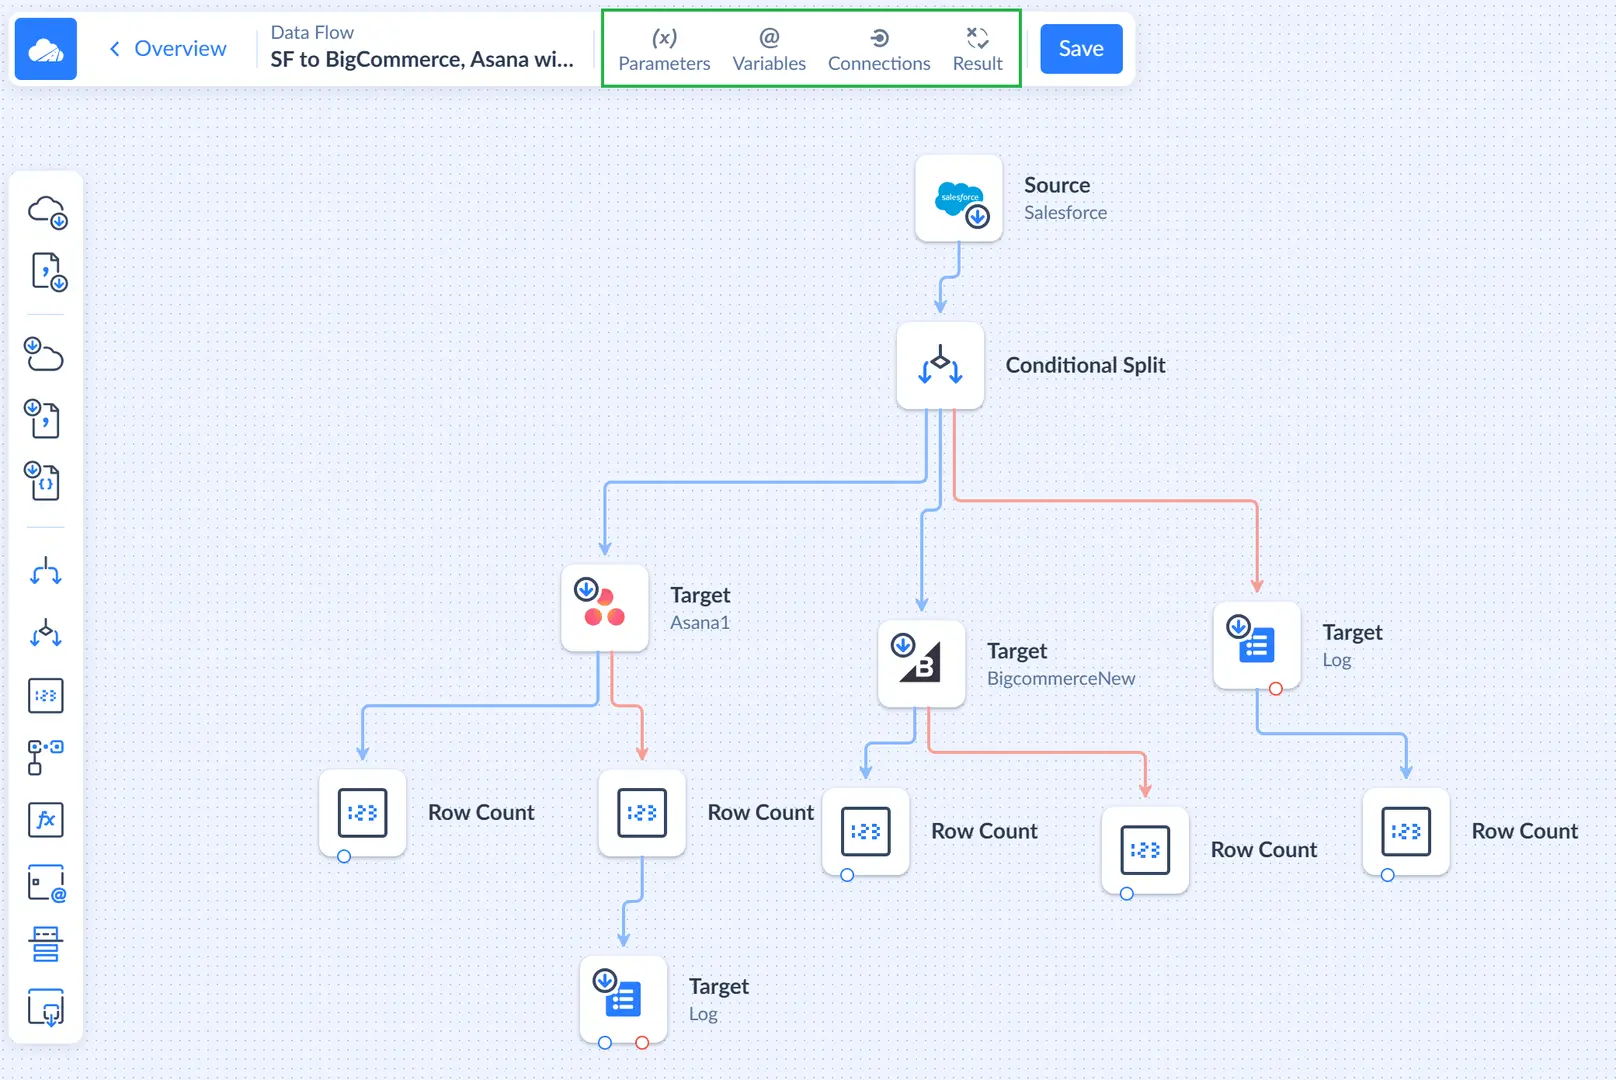
Other Data Flow Settings
Skyvia offers additional data flow settings, which you can manually configure in the toolbar on the left. Here you find such settings as Parameters, Variables, Connections, and Result.
Adding Parameters and Variables to the Data Flow
Parameters allow you to store values between data flow executions. Whenever necessary you can view and edit their values or edit the parameter list.
Variables are used to store values during the data flow execution. Components, like Count or Value, can assign values to them, and you can use their values in other components.
To manage data flow parameters and variables, click Parameters or Variables respectively on the toolbar and create new parameters/variables as described in the Parameters and Variables topic.
Creating Log
Log is a table that you can fill in with data in your data flow. To create a log, click Connections in the toolbar on the left.
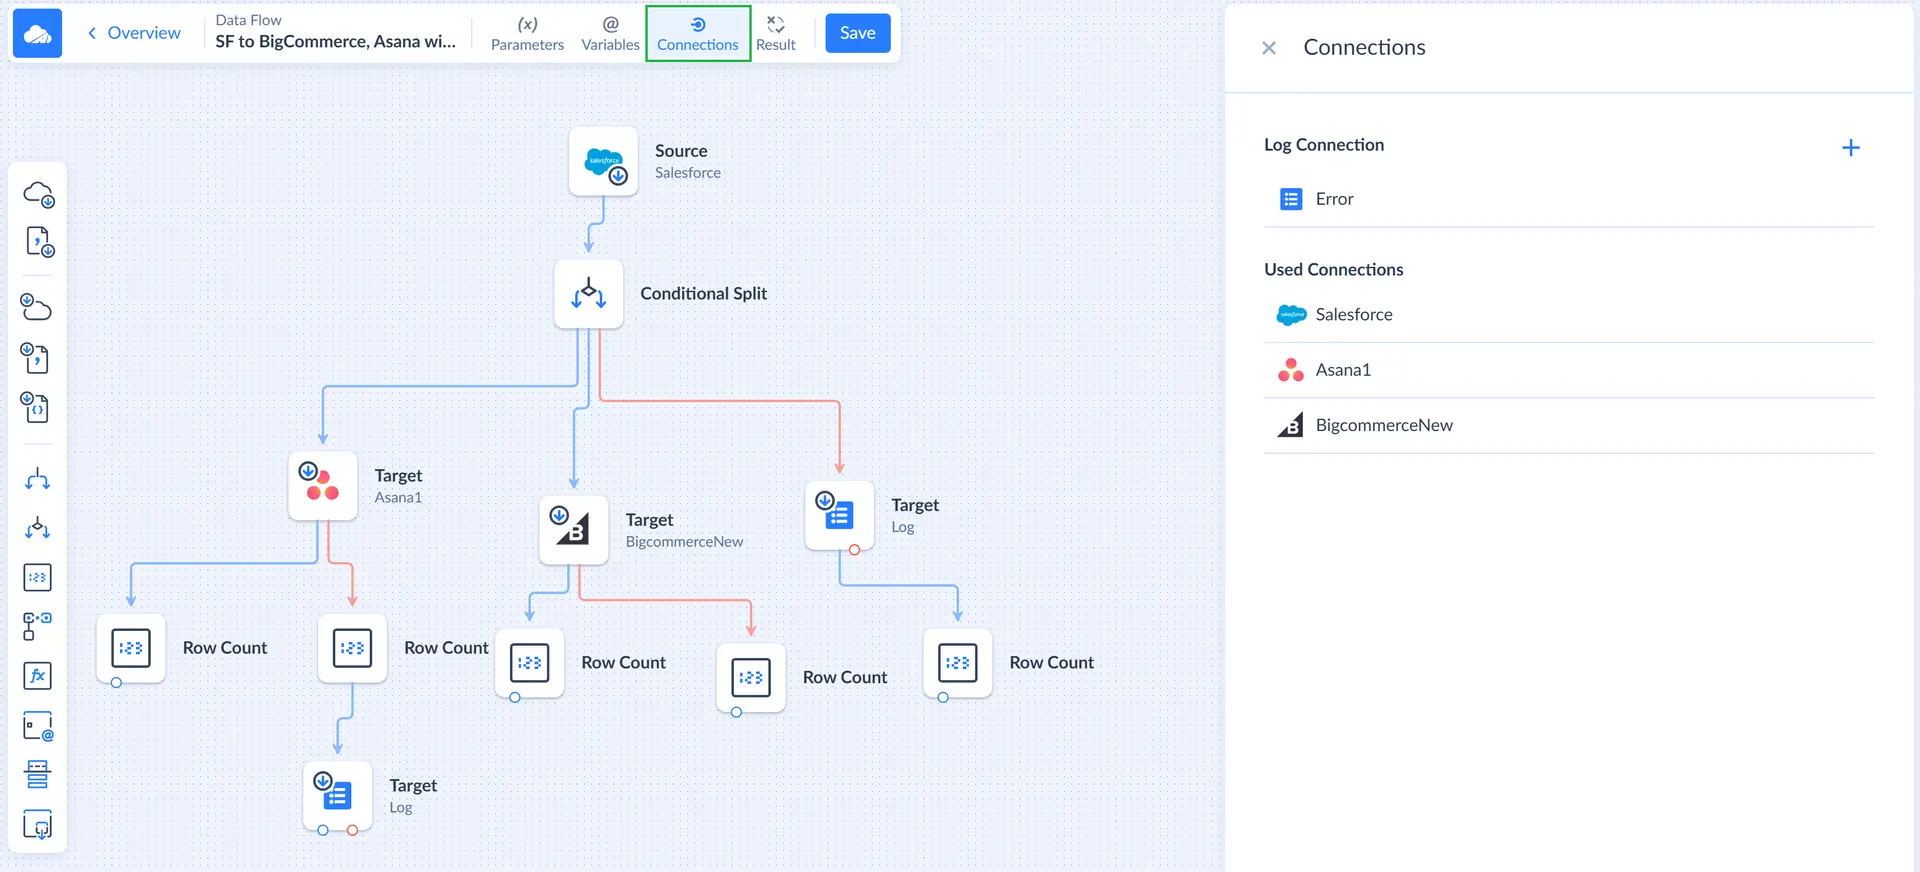
When the Connections sidebar opens on the right, click ![]() to add a log and adjust its settings. In the opened window, add name, schema and save changes.
to add a log and adjust its settings. In the opened window, add name, schema and save changes.
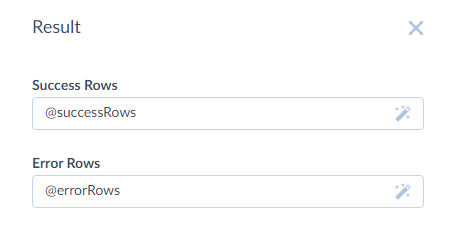
Calculating Result
Result feature helps you specify how the number of success and error rows counted by the Row Count component is calculated. To calculate result, click Result in the toolbar on the left. The Result sidebar opens on the right, and there you can specify how to calculate the number of rows.
Usually, you can just sum up the necessary variables used in the Row Count components, but you may also specify more complex expressions if needed. For this, click the  button and edit the expression in a convenient editor with code completion, validation, and result preview. You can read more about the Result feature here.
Saving and Naming the Data Flow
After you have finished configuring your Data Flow, you can save it, using the Save button. The first time you save a new Data Flow, you need to specify the name for it and the workspace folder where it is stored. The default data flow name is Untitled. Please note, if you omit this step, the data flow name will remain Untitled in the list of created integrations.
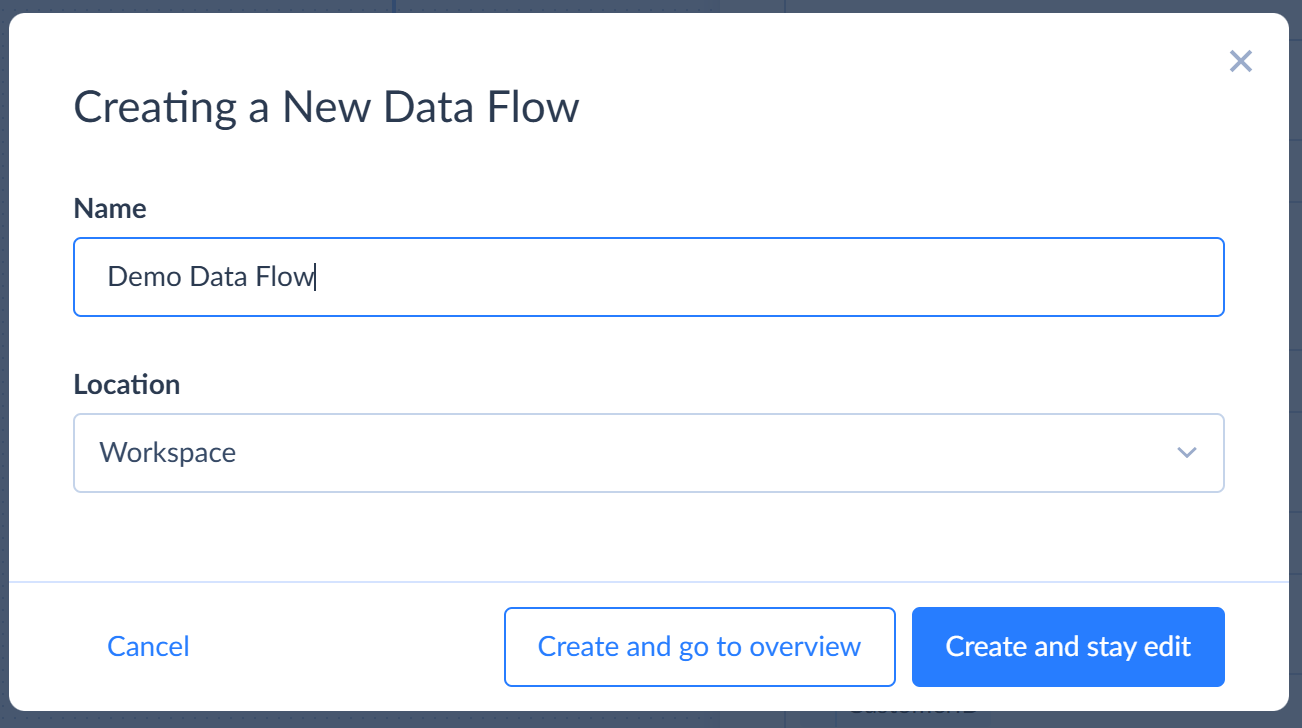
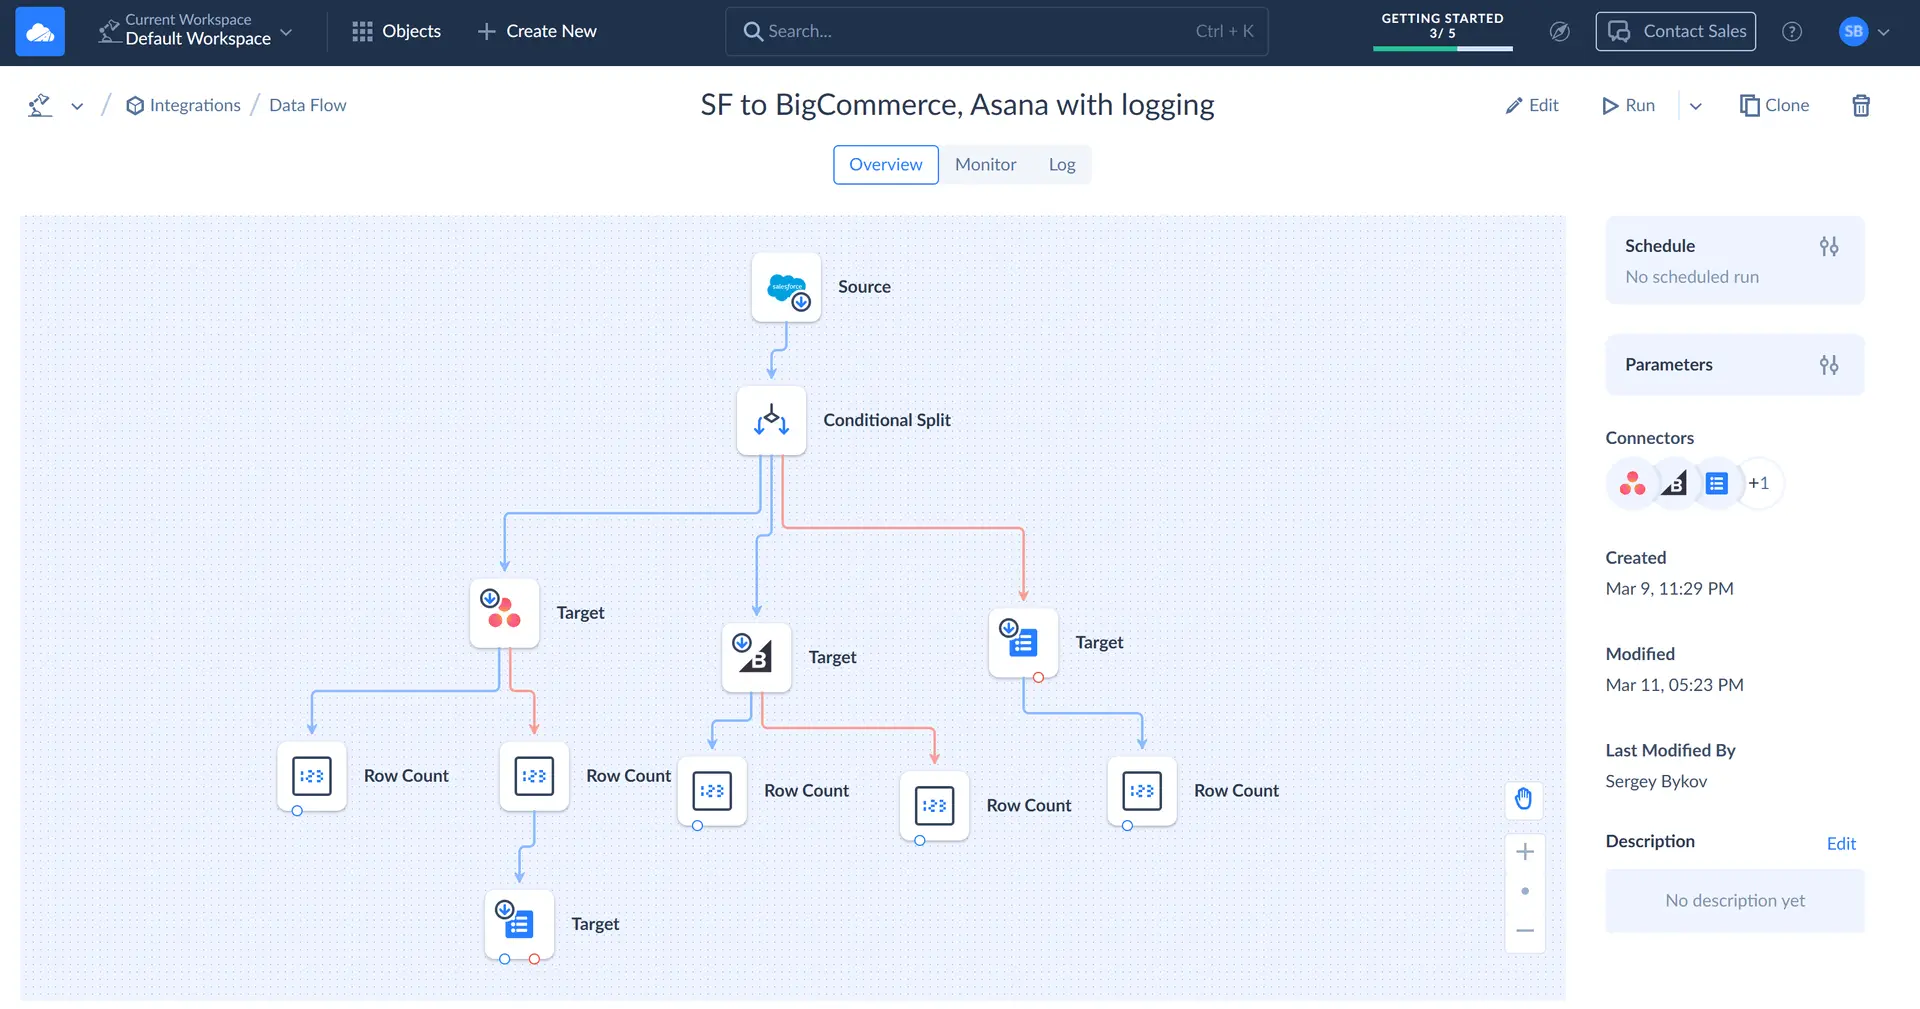
You may either create a data flow and go to its Overview, or create it and stay in the edit mode. On the Overview page you can change the name of an existing data flow, edit its parameter values and schedule, run it, and start editing it again.
Scheduling the Data Flow
You can schedule your data flow for automatic execution. It might be very useful if you want to configure a data flow to run periodically on certain days and at a particular time or if you want to delay a data flow execution to a later time. To open the schedule editor for a data flow, click the ![]() button near Schedule on the data flow Overview. Check the Scheduling Integrations section for more details.
button near Schedule on the data flow Overview. Check the Scheduling Integrations section for more details.