How to Design Control Flow
In Skyvia, control flows are built on the diagrams. It is a place where you add your components to the control flow branches and rearrange them. We've developed the diagram canvas to be far larger than your computer screen and added helpful features for you to be able to navigate easily around your canvas and move components as you like.
Working with the Control Flow Diagram
To create a control flow, click +NEW in the top menu and select Control Flow under the Integration column.
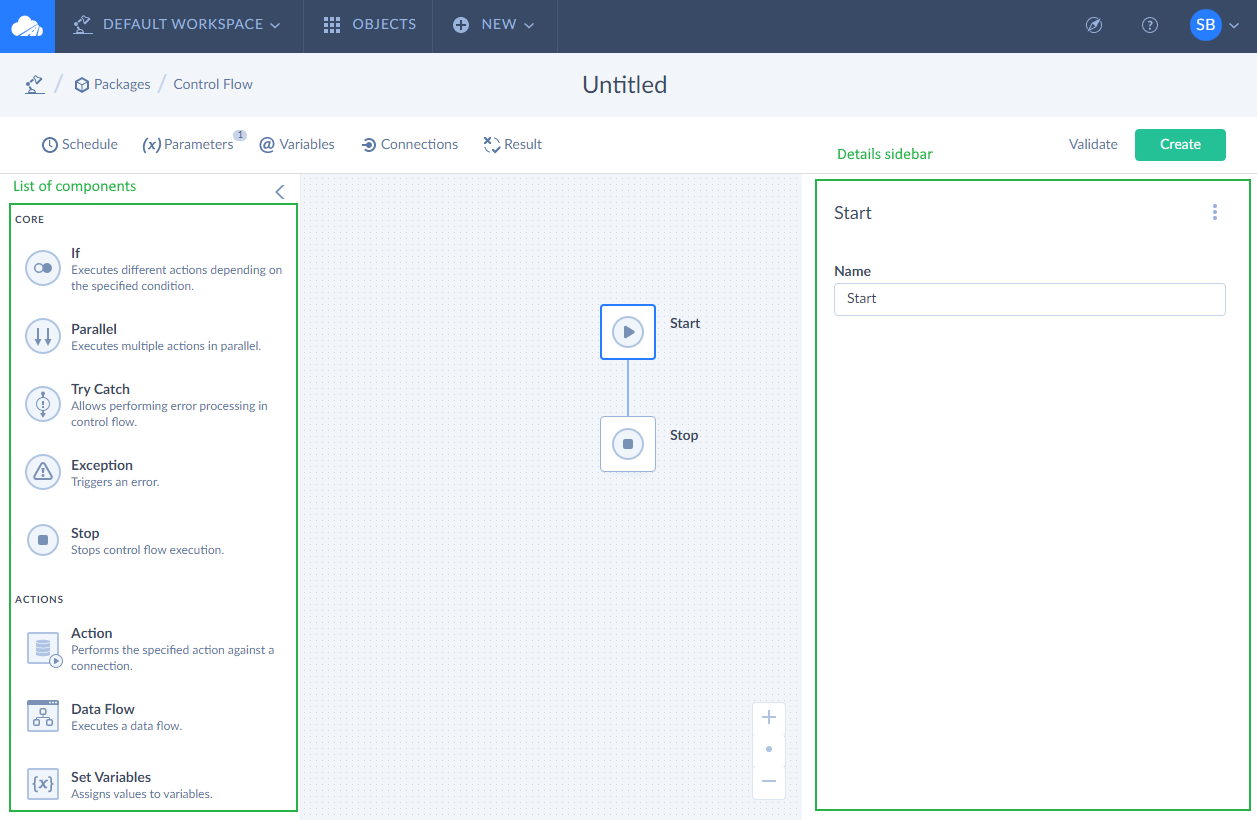
When the Control Flow editor opens, on the left side of the page you see a list of components, which you can use to build your control flow. On the diagram, you can see the first two components - Start and Stop, and a branch connecting them.
When building a control flow, drag components one after another to the branches of the diagram and then configure settings of each component in the details sidebar. The sidebar opens on the right when you click a component you want to configure setting of.
Adding Components to the Diagram
To add a component, you need to drag it from the components list to a specific place on one of the diagram branches before/after other components. When you start dragging a component, these places are displayed on the diagram as squares with the plus sign. You can drop the component onto one of such places.
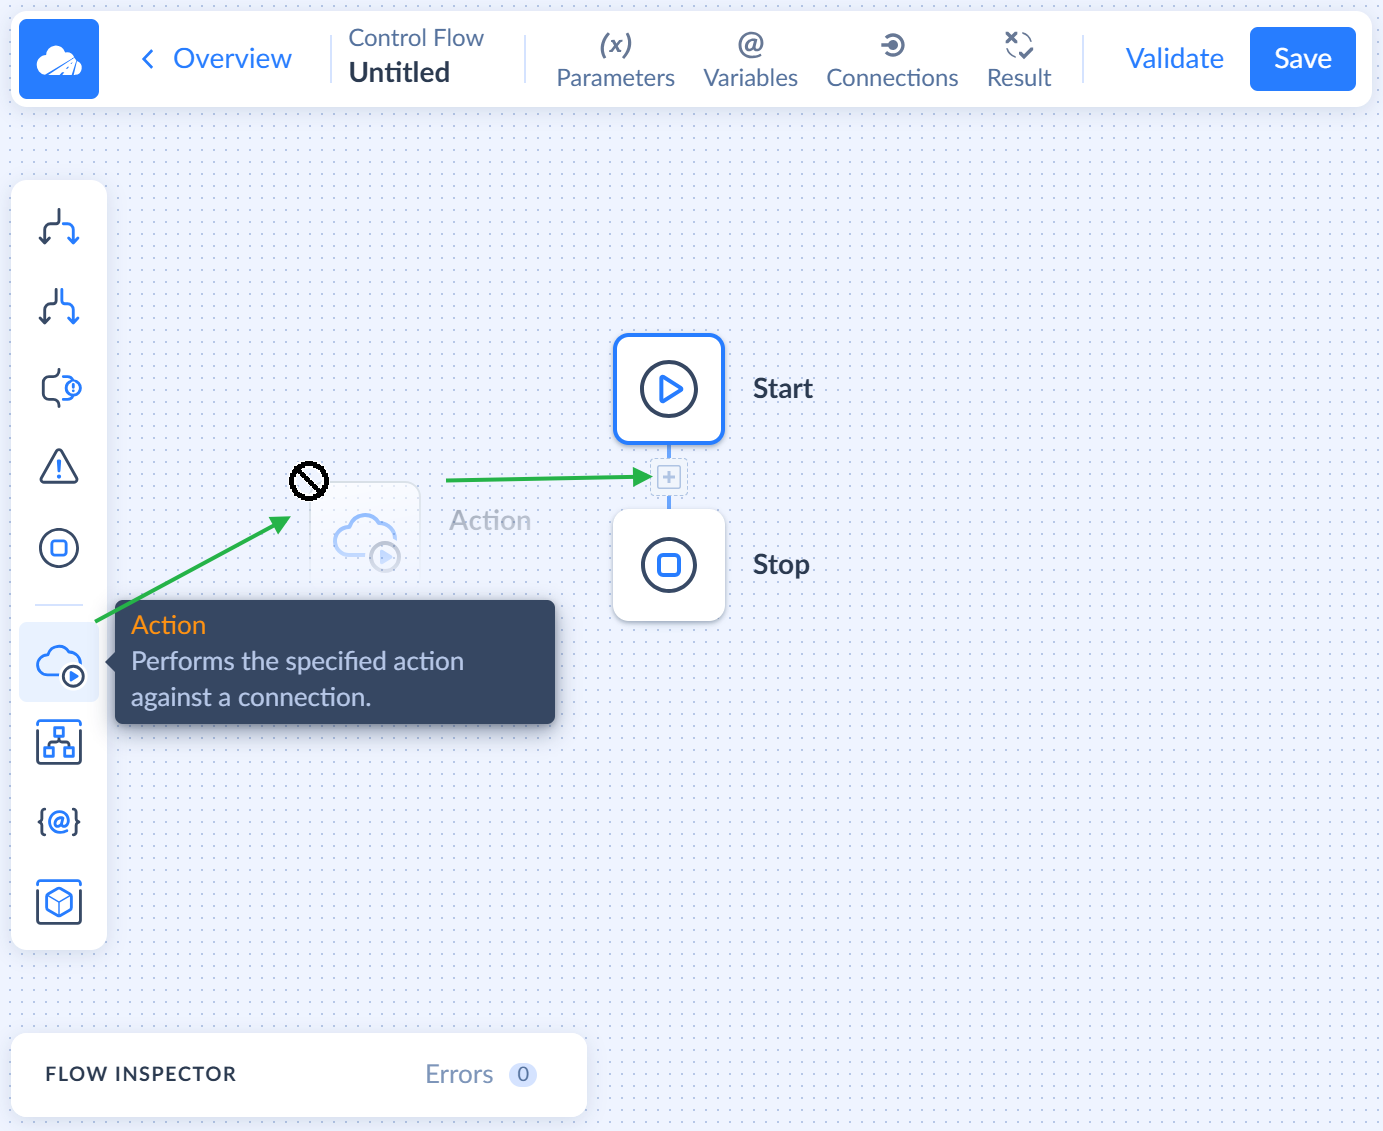
Core components are control blocks - they affect how execution is going, add more execution branches, redirect execution, based on conditions, etc. Tasks components perform interaction with data sources or set variables. You can add any of them to any suitable place on the branches.
Component Name and Other Settings
After a component is placed on a branch, you may configure its settings. They are configured on the Details sidebar on the right, which is displayed when you select the component on the diagram.
Component settings are specific for each component, and you can read about these settings in the Components topic. The only setting they share in common is Name, which you can change for any component. You can give any component a meaningful name, which will be displayed on the diagram, to make your control flow easier to understand.
Moving Components on the Diagram
If necessary, you can move any added and configured component to another place. Just start dragging it, and Skyvia will show all the allowed places where you can drop it. Note that if you move a control block component that adds branches, like If or Try Catch, it will be moved with its branches and all the components on these branches.
Deleting Components
To delete any component from the diagram, simply click on it. As soon as you do it, you will see the three-dotted button next to the component. Click it and select Delete from the menu. To select another component for deletion, perform the same steps.
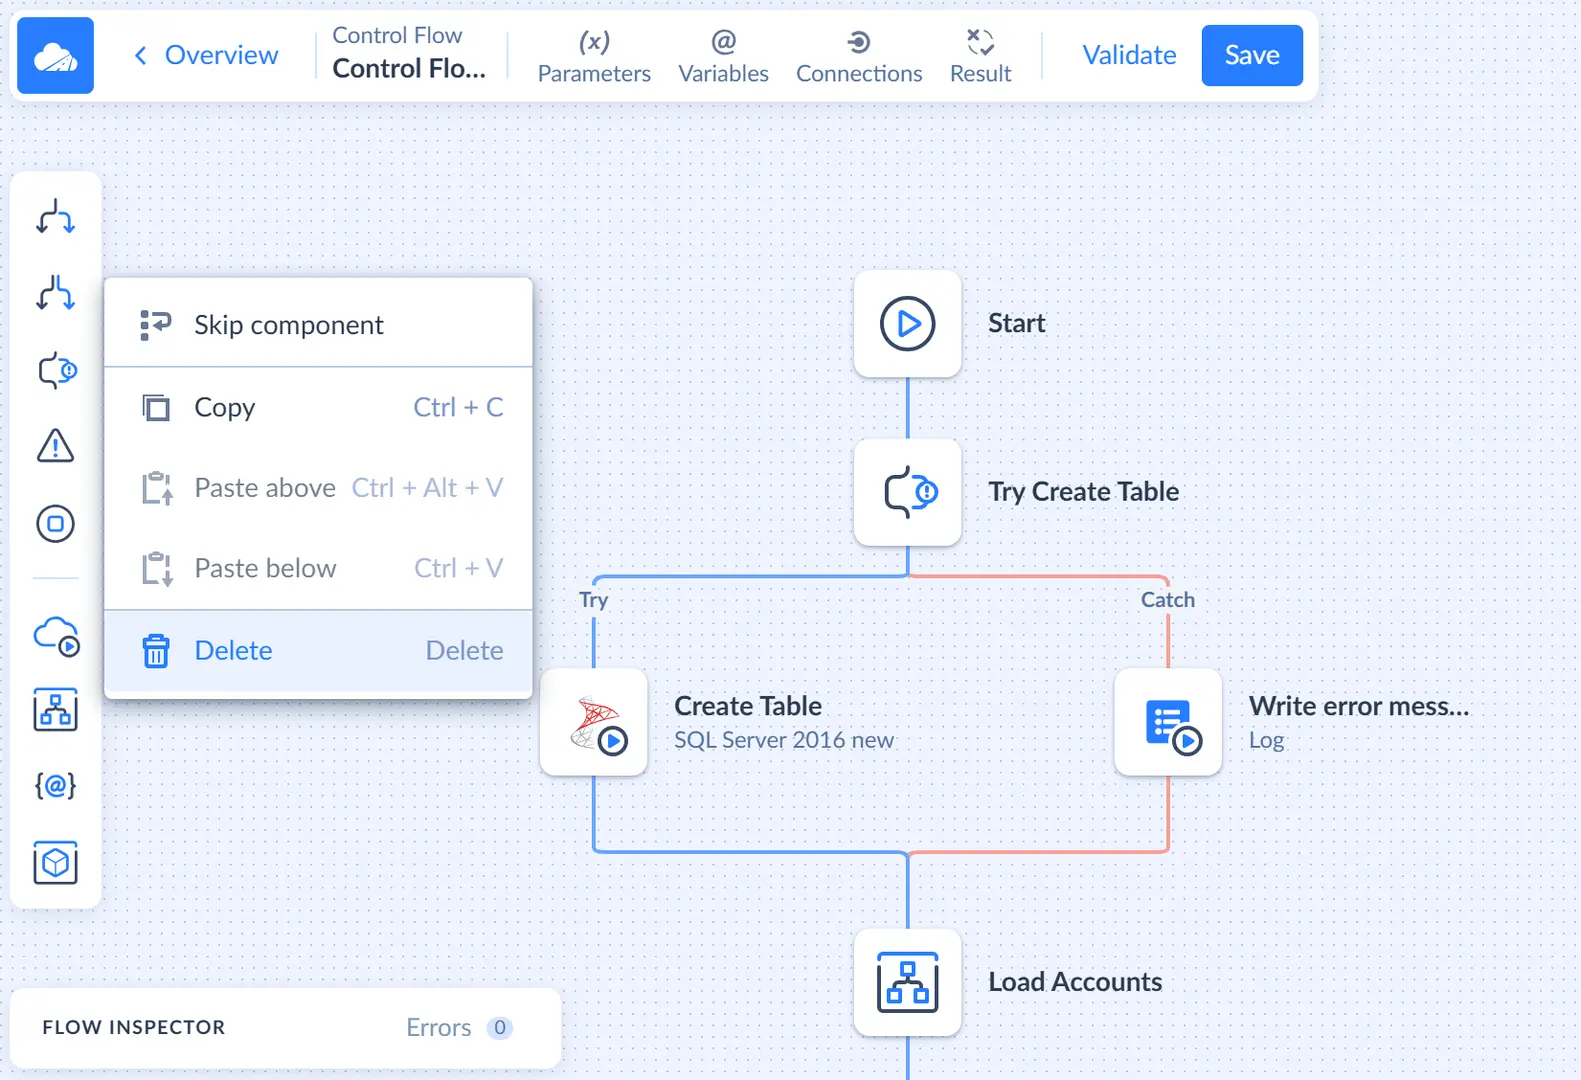
Note that if you delete a control block component that added branches from a control flow, you will also delete its branches and all other components on these branches.
If you want only to temporarily disable the component for testing purposes but not delete it with all its settings, select Skip component instead of delete. The component won't be executed, but will stay on the diagram, and you will be able to re-enable it anytime.
Working with Diagram Canvas
As mentioned earlier the diagram canvas is designed to be far larger than your computer screen, so we've added helpful features for you to be able to navigate easily around your canvas and move the diagram or components as you like.
Navigating
For some large control flows, you will need to move the diagram up and down or sideways to see all of its components. For this, you can use either panning or scrolling. To use panning, press and hold the left mouse button anywhere on the canvas and, holding it, move your mouse to move the canvas. The pan occurs in real time, which means you see how the work area moves as you drag it across the screen. The other way to navigate the diagram is to use the scroll wheel of a mouse. Spinning a scroll wheel will move the diagram up and down on the canvas. Holding the shift key and spinning the wheel will shift the canvas horizontally left and right.
Zooming
You can zoom in and out of the diagram canvas to adjust your view. Click the  Zoom In icon to increase the zoom level or click the
  Zoom Out icon to decrease the zoom level. That's zooming. It is good to note that the zoom uses the middle of the canvas as its point of reference so combining panning and zooming is a great way to effectively move around the canvas.
![]()
Please note that you can easily return the original diagram size and location on the canvas by clicking the ![]() Default icon.
Default icon.
Other Control Flow Settings
Skyvia offers additional control flow settings, which you can manually configure in the toolbar on the left. Here you find such settings as Parameters, Variables, Connections, and Result.
Adding Parameters and Variables to the Control Flow
Parameters allow you to store values between control flow executions. Whenever necessary you can view and edit their values or edit the parameter list.
Variables are used to store values during the control flow execution. Note that variables and parameters, created in the Control Flow are also available in its data flows, created via the Data Flow components. You can set them within the data flows and then build logics depending on them, using control block components, depending these variables.
To manage data flow parameters and variables, click Parameters or Variables respectively on the toolbar and create new parameters/variables as described in the Parameters and Variables topic.
Creating Log
Log is a table that you can fill in with data in a data flow. To create a log, click Connections in the toolbar on the left.
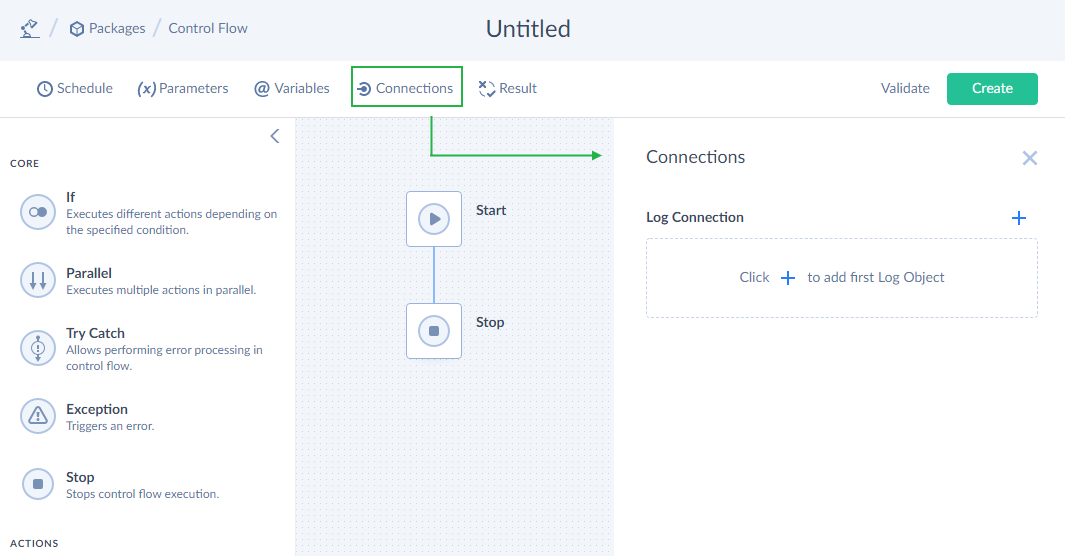
When the Connections sidebar opens on the right, click ![]() to add a log and adjust its settings. In the opened window, add name, schema and save changes.
to add a log and adjust its settings. In the opened window, add name, schema and save changes.
Control flow logs are available in all its data flows, created via the Data Flow component, so you can fill the logs within these data flows.
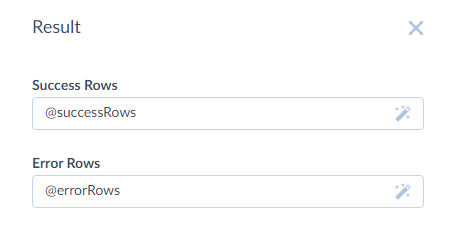
Calculating Result
Result feature helps you specify how the number of success and error rows counted by the Row Count component is calculated. To calculate result, click Result in the toolbar on the left. The Result sidebar opens on the right, and there you can specify how to calculate the number of rows.
Usually, you can just sum up the necessary variables used in the Row Count components, but you may also specify more complex expressions if needed. For this, click the  button and edit the expression in a convenient editor with code completion, validation, and result preview. You can read more about the Result feature here
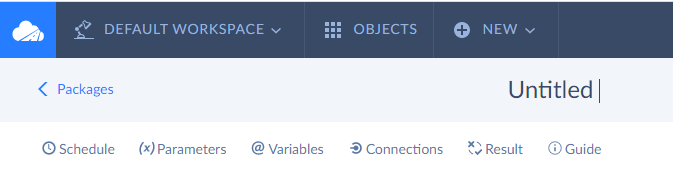
Saving and Naming the Control Flow
After you have finished configuring your Control Flow, you can save it, using the Save button. The first time you save a new Control Flow, you need to specify the name for it and the workspace folder where it is stored. The default control flow name is Untitled. Please note, if you omit this step, the control flow name will remain Untitled in the list of created integrations.
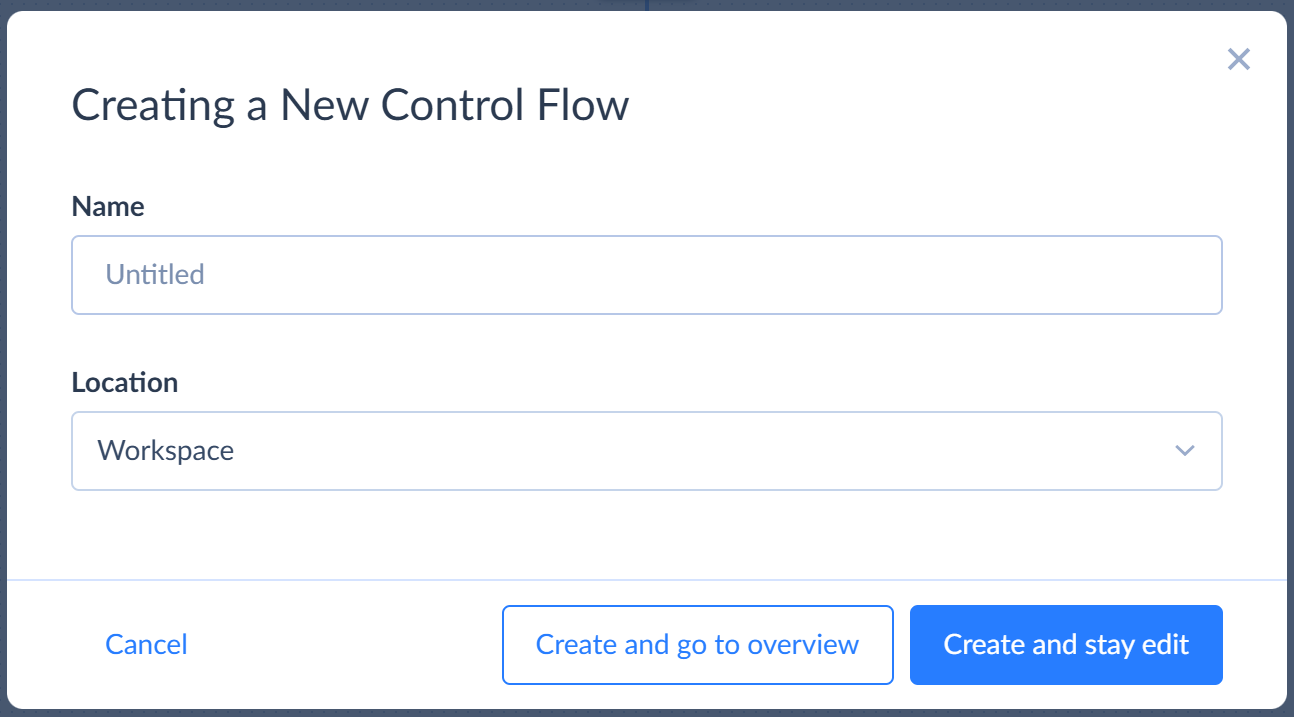
You may either create a control flow and go to its Overview, or create it and stay in the edit mode. On the Overview page you can change the name of an existing control flow, edit its parameter values and schedule, run it, and start editing it again.
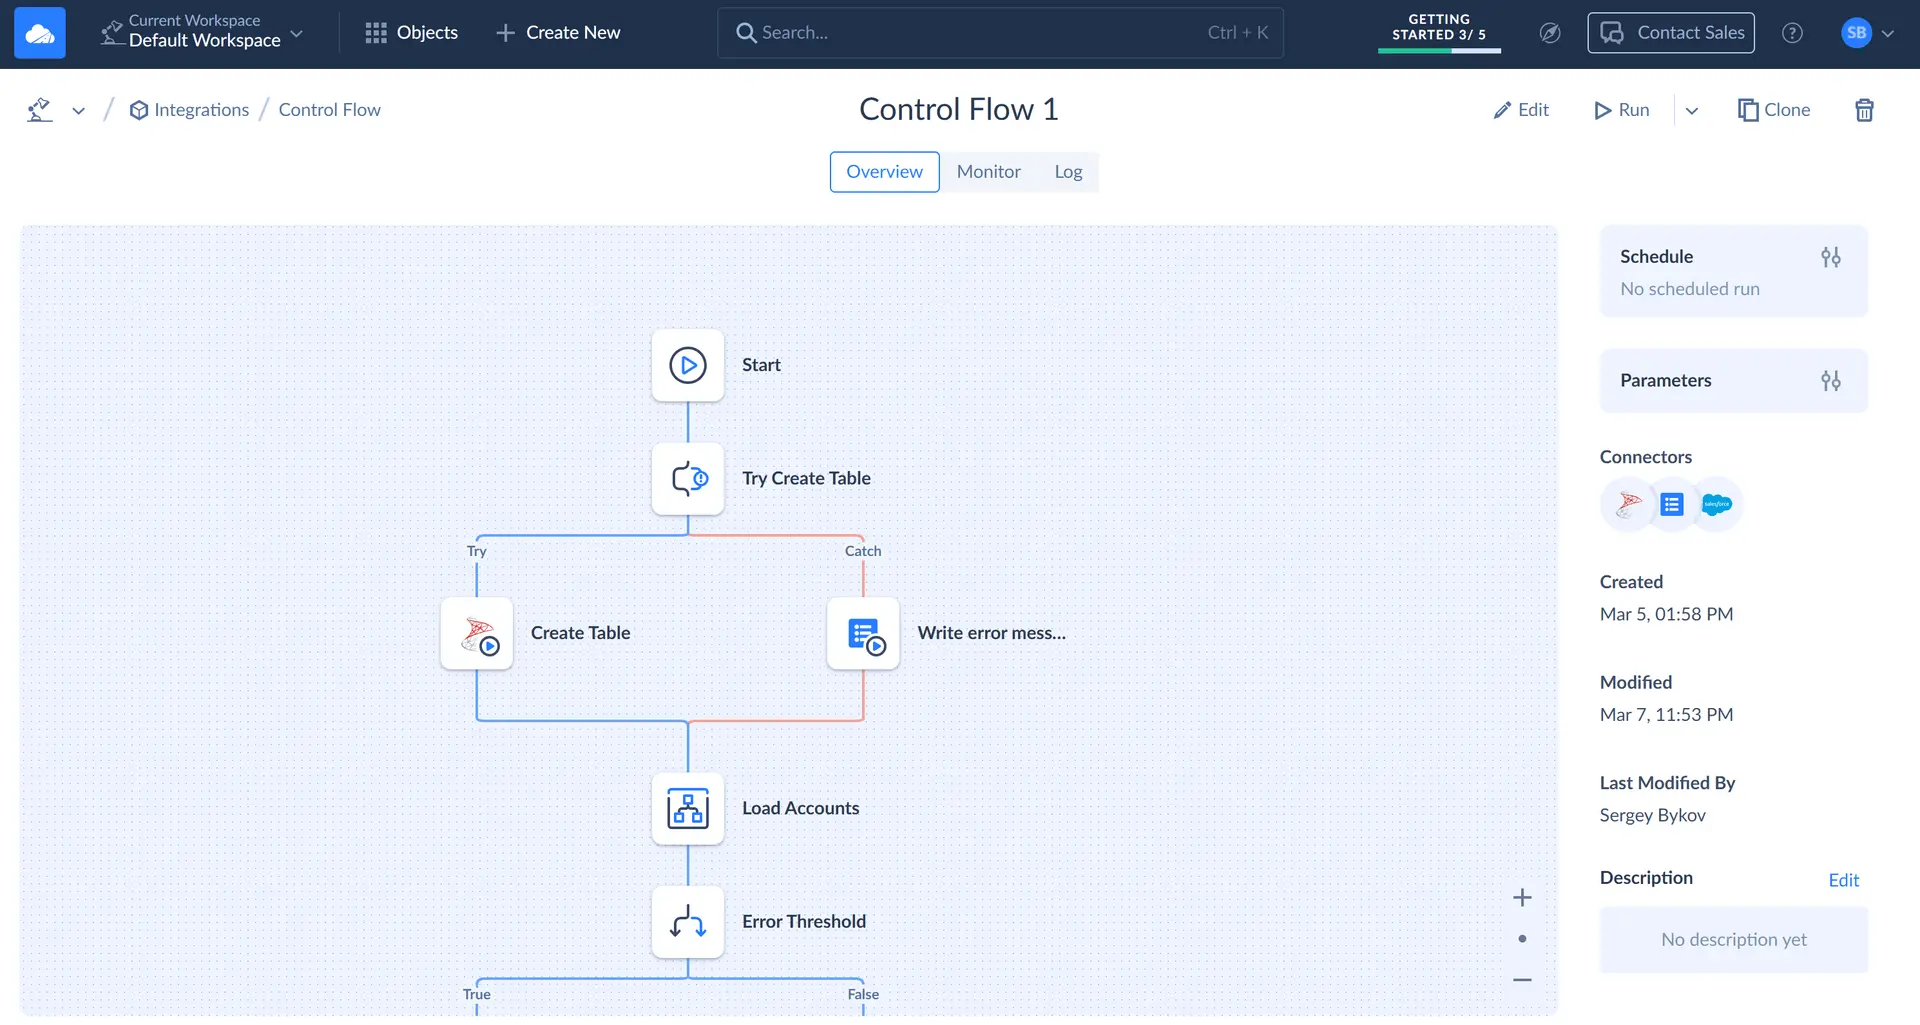
Scheduling the Control Flow
You can schedule your control flow for automatic execution. It might be very useful if you want to configure control flow to run periodically on certain days and at a particular time or if you want to delay a control flow execution to a later time. To open the schedule editor for a control flow, click the ![]() button near Schedule on the control flow Overview. See the Scheduling integrations section for more details.
button near Schedule on the control flow Overview. See the Scheduling integrations section for more details.