Debug Mode
Debug mode lets you set breakpoints on component outputs, check component states, view the number of processed records, and inspect output data. This helps you locate errors and monitor how data changes at each stage of the Data Flow.
Entering Debug Mode
Open your Data Flow integration, click Edit, and select Debug mode at the top.
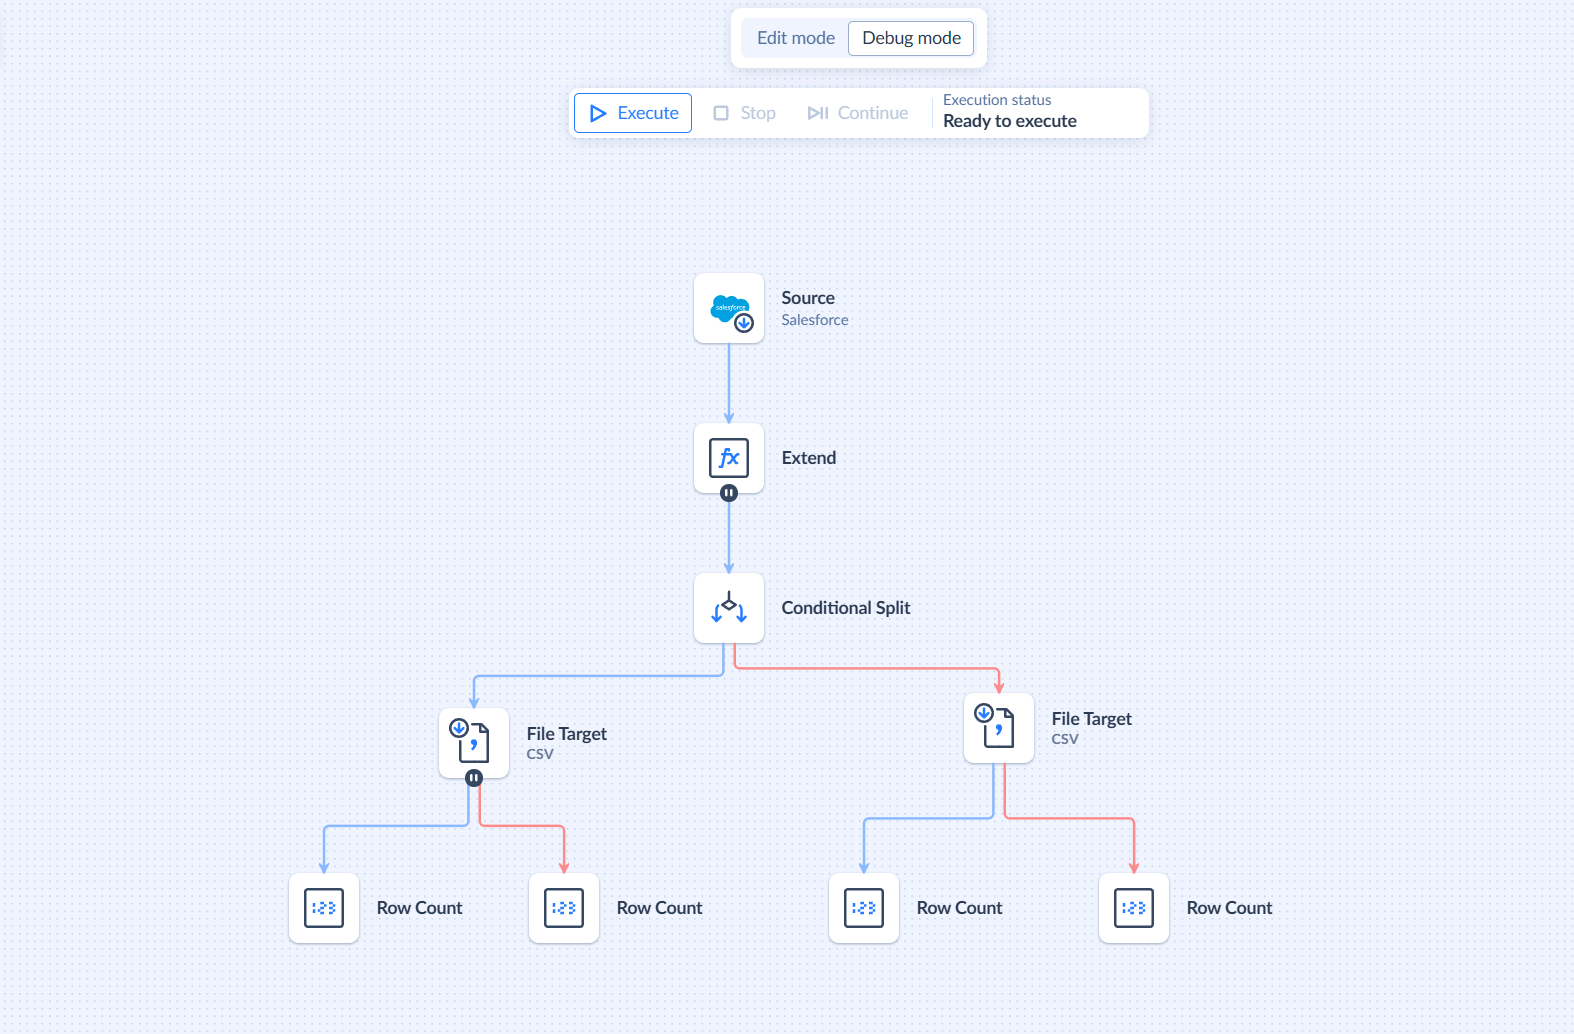
Adding Breakpoints and Starting Execution
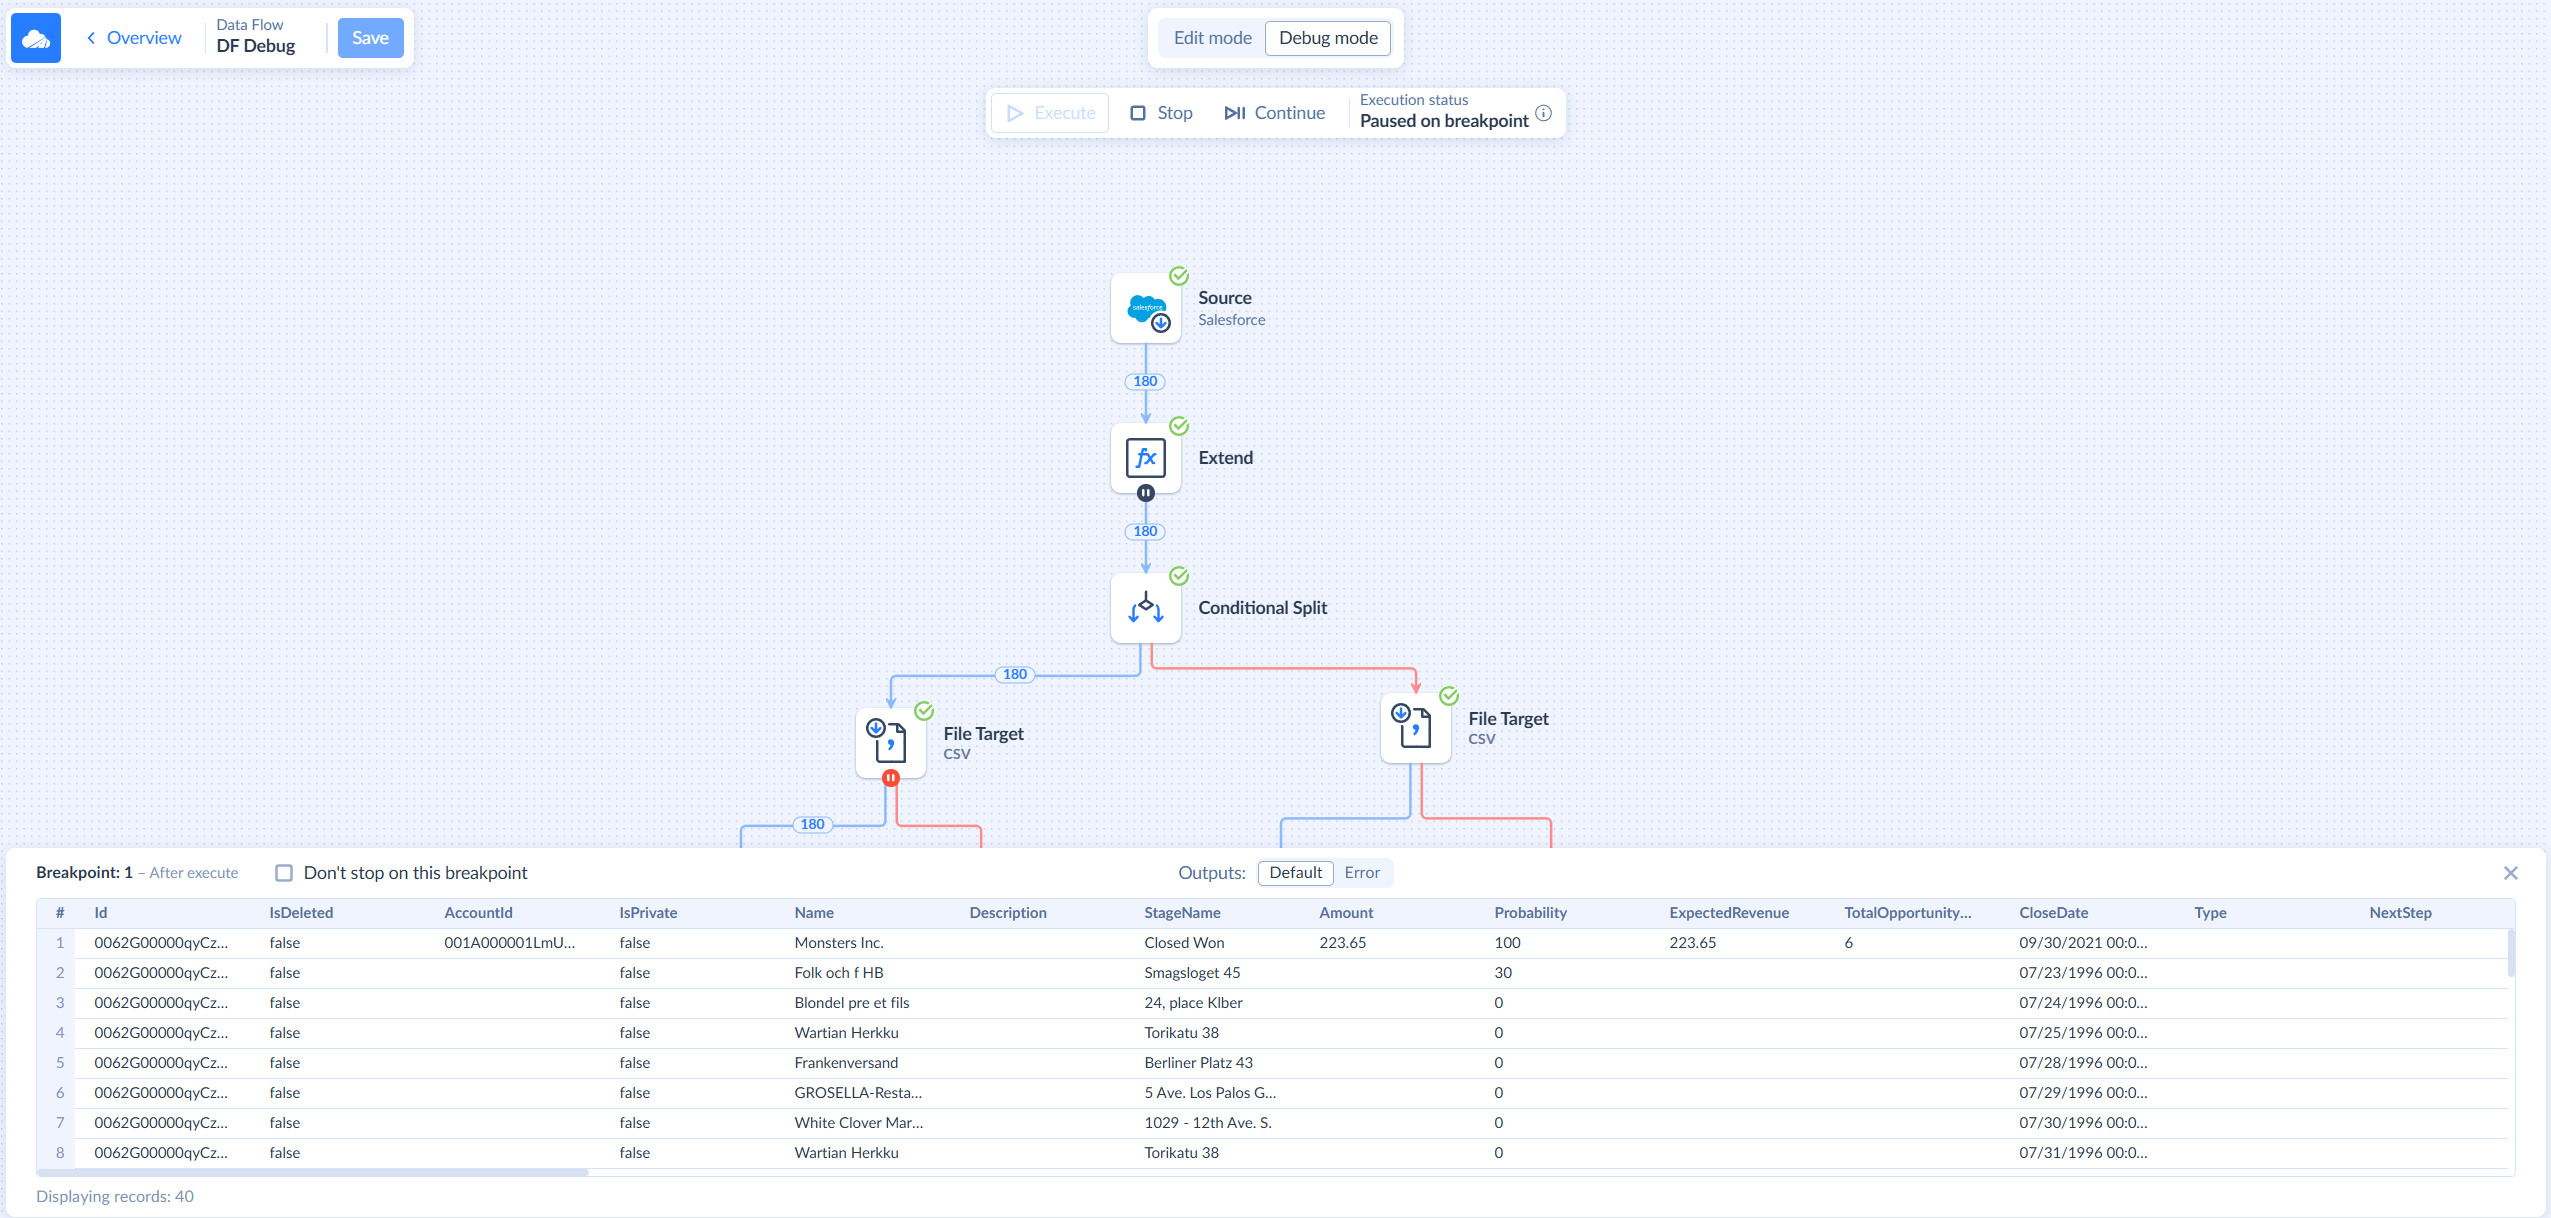
Add breakpoints to the component outputs you want to inspect. Then, click Execute to run the Data Flow in Debug mode.
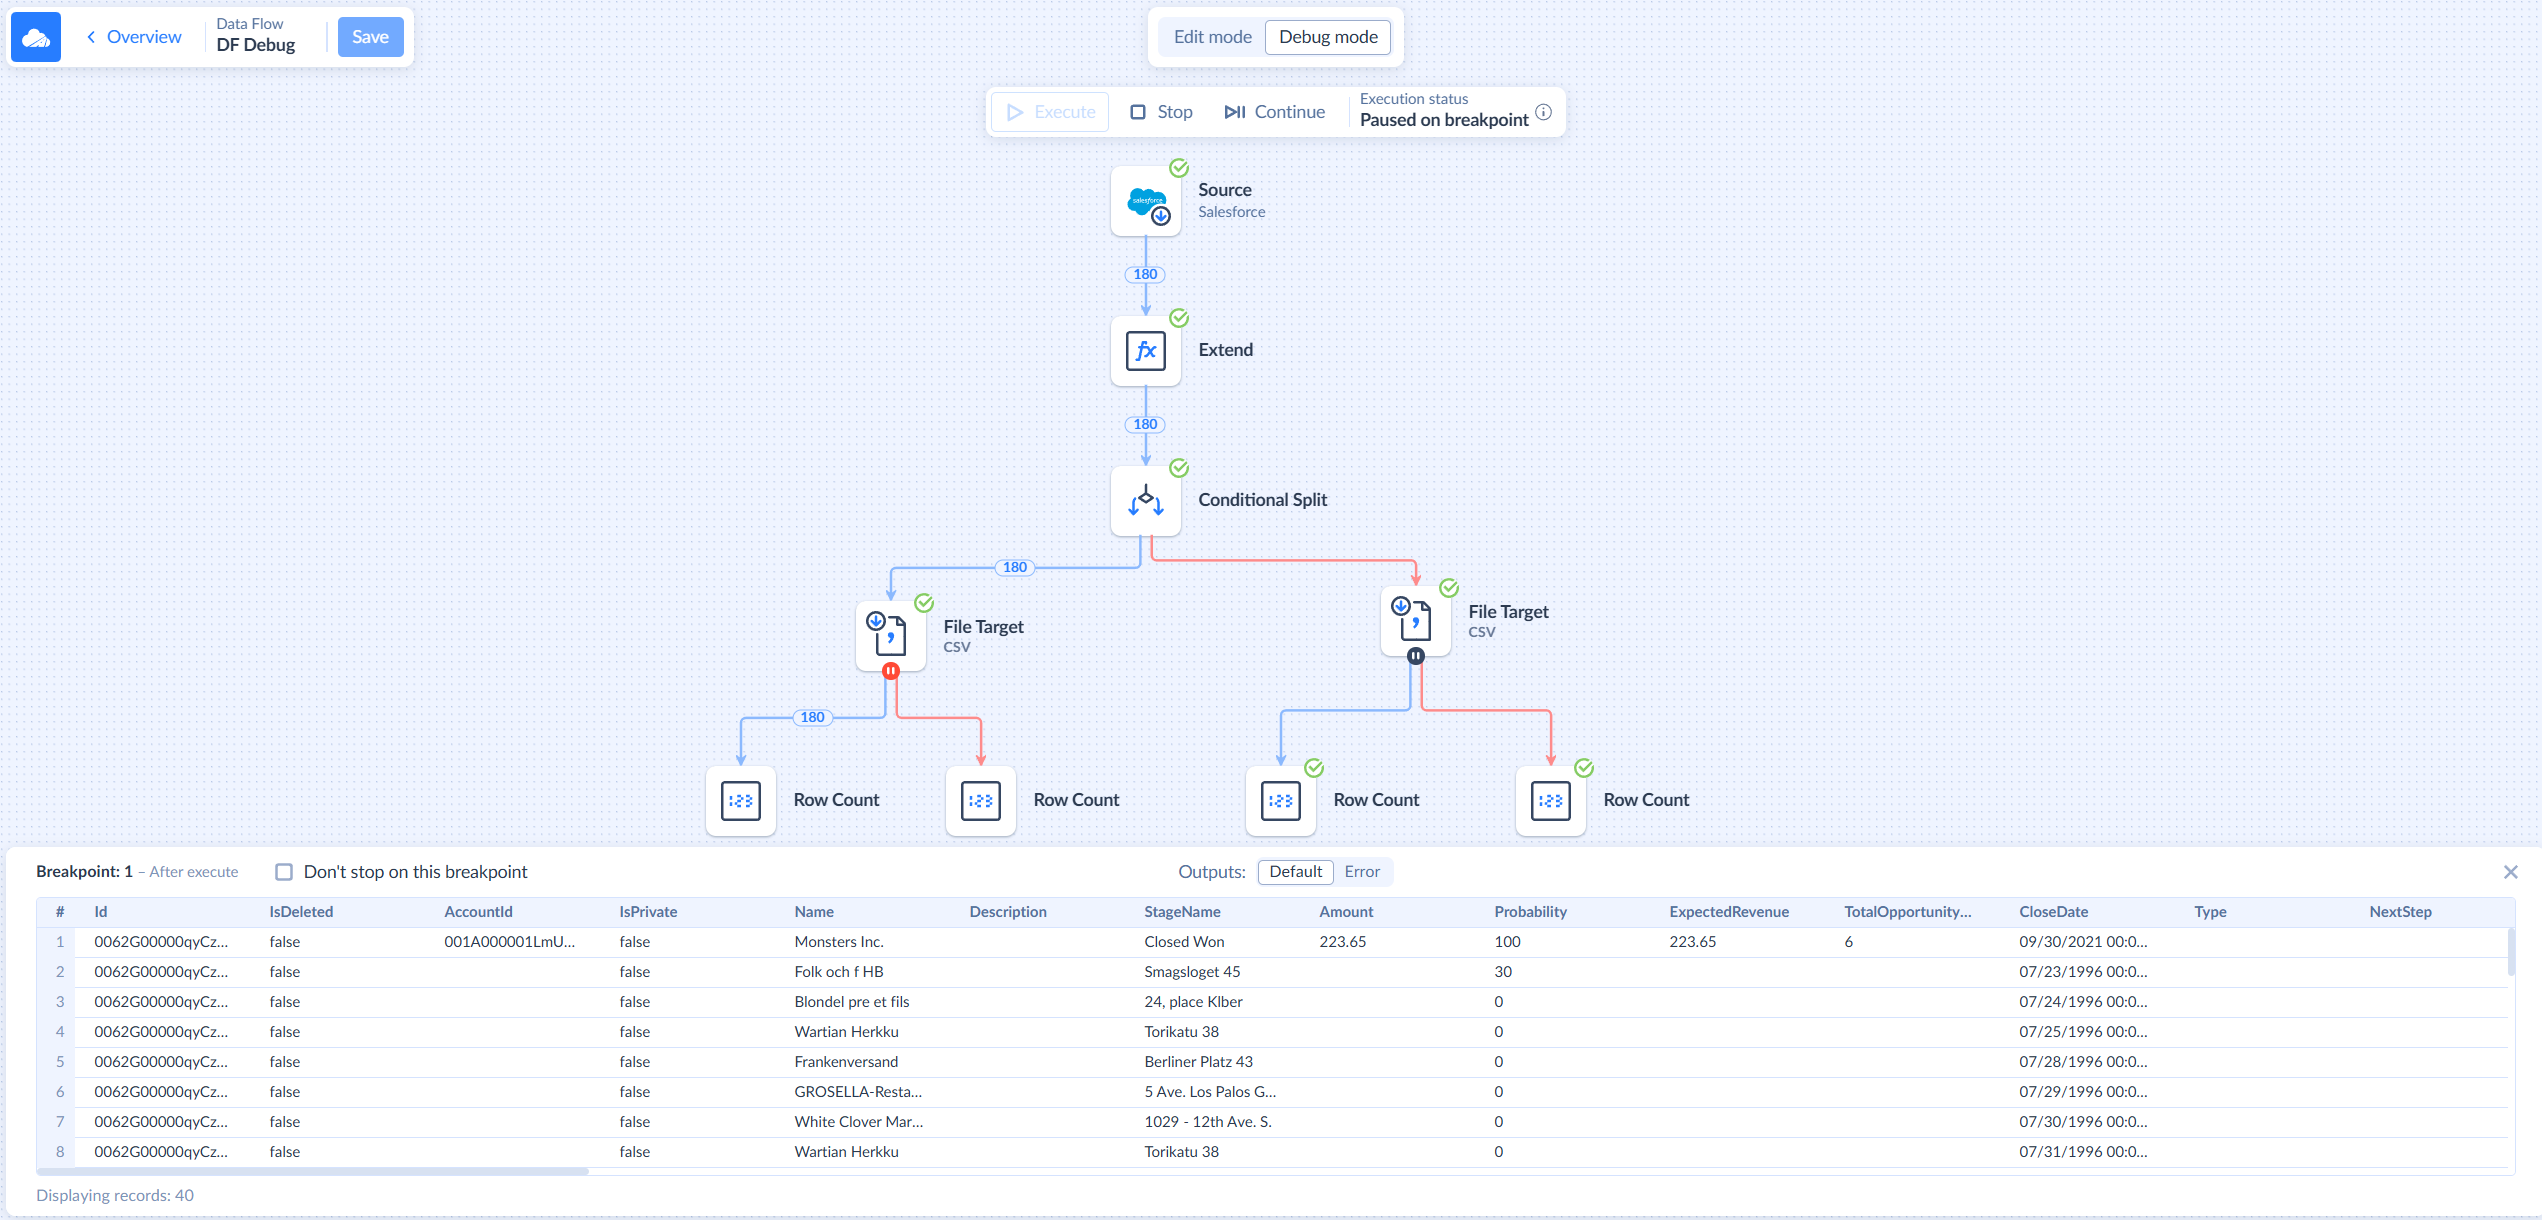
The Data Flow stops at the first breakpoint. The active breakpoint changes from black to red, making it easy to locate. You can see the number of records processed between each pair of components before the breakpoint, as well as the number of records processed at the output where the breakpoint is set.
Inspecting Output Data
A preview of the output data appears at the bottom of the screen. If a component has multiple outputs, use the Outputs toggle to switch between them.
By default, data is transferred in batches of 2,000 records. After one batch passes through the entire Data Flow, the process repeats for the next batch until all data is processed.
You may want to disable some breakpoints for subsequent batches. To prevent the Data Flow from stopping at a breakpoint again, click Don't stop on this breakpoint.
Controlling the Execution
To continue to the next breakpoint, click Continue. You can cancel the Data Flow execution at any time by clicking Stop.

Checking the Execution Status
You can check the Data Flow execution status at the top of the editor. The following statuses are available:
| Status | Description |
|---|---|
| Ready to execute | The Data Flow is ready to run. |
| Executing | The Data Flow is currently running. |
| Paused at breakpoint | The Data Flow has reached a breakpoint and is waiting for you to continue or stop the execution. |
| Succeeded | The Data Flow execution completed successfully. |
| Canceling | The Data Flow execution is being canceled. |
| Canceled | The Data Flow execution was canceled successfully. |
| Failed | The Data Flow execution failed because of an error. |
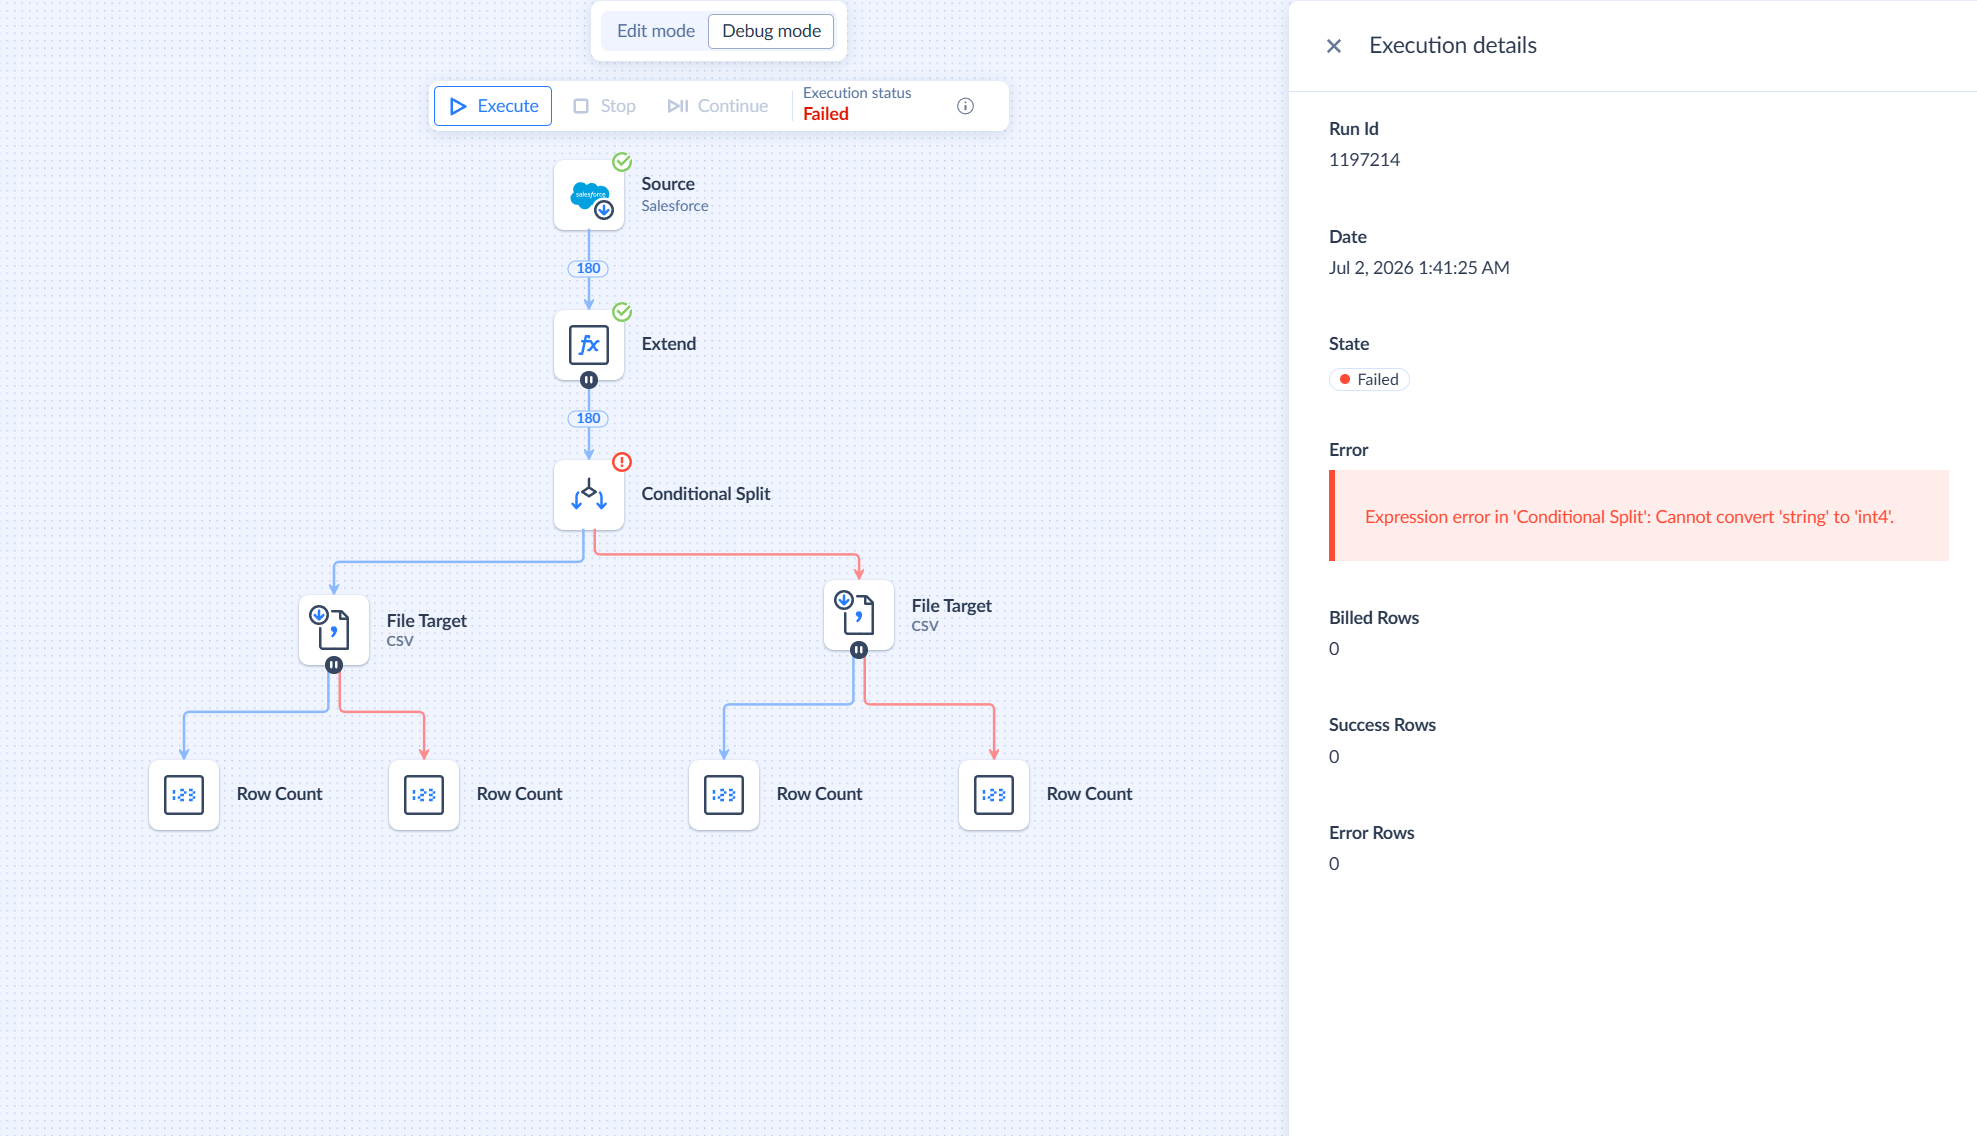
Troubleshooting a Failed Execution
If the status is Failed, click the icon next to the status to open Execution details. Find the Error block to view information about the cause of the failure.